
Gold broke and plummeted, and this week's Federal Reserve report may become a "dark horse".
foreign exchange trading platform- Fundamental news, coupled with the "Tai Chi" market, has returned to the starting point after a week of opening, which continues to suggest that the long-short saw-saw trend will continue. Gold's market last week was basically in line with the June 17 reminder. The subsequent confirmation of the step back, the sharp rally and the head decline were all expected.
In the morning of June 17, we reminded that gold in the week of 0617-0621 (last week) "breaking direction is about to come out" but the overall market is volatile, the actual market is basically the same as the reminder: spot gold last week after three days of shock, the fourth day "breaking" (breaking through the green resistance line on the daily chart) rose sharply more than $35, but the fifth day plummeted nearly $50, and finally closed at the pointed small negative line at 2321.19 dollars/ounce. [June 17 reminder article: gold breaking direction is about to come out, long and short attention to these points]

Among them, the breakout rise opened in the Asian market on June 20, the subsequent confirmation of the step back, the more substantial rise, and the short-term head on Friday the next day - the explosive decline, are all expected. The price of gold encountered resistance near 2370, which can be seen from the overlapping resistance of the two "yellow lines" on the gold daily chart below.
The fundamental news is also in line with the "Tai Chi" market. The situation in the Middle East is uncertain, and the US data is mixed: last week's US retail sales were weak, but industrial output and manufacturing PMIs were strong, and initial jobless claims and housing market data were mixed. And this trend is expected to continue in the near future.
From a technical point of view, the daily chart gold price decisively broke through the green line resistance that we reminded attention on June 20, but the next day resolutely fell back to the vicinity of the red support line (also reminded attention). It seems that it has returned to the starting point after a week of opening, which continues to suggest that the long-short sawing trend will continue. According to the rhythm of the long-short rotation, the gold bulls are expected to wait for an opportunity to gain strength after gaining a firm foothold at the beginning of this week (week 0624-0628). If it rises to the 2387 area, the short-term bears may be in power again.
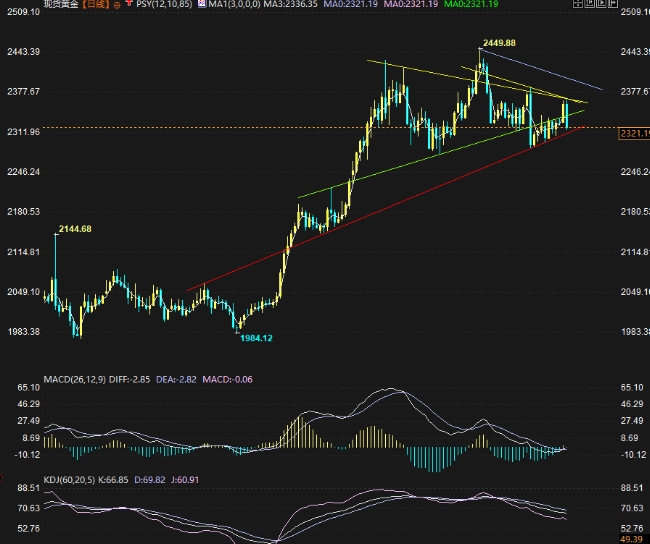
Spot gold daily chart technical analysis
From the 4-hour chart, the price of gold fell rapidly from the 2368.62 to the 2321 line, almost from the recent rebound channel along a breath fell to the lower edge of the support line, pay attention to the channel (purple line) under the rail support line can make the price rebound, but it should be noted that this lower edge has provided support twice before, so there is a possibility of falling below.

4-Hour technical analysis of spot gold
If you fall below the purple lower edge support in the above chart, the support near the bottom is also relatively dense, followed by 2310-2305, 2300-2295, and then 2286. If there is no major bearish, it is expected that the price of gold will not fall below 2286 for the time being. If there is a drop below, it means that the market has entered a new stage at the daily chart level. Once established, it will accelerate the decline. This is the case later. The current preliminary resistance focuses on 2329-2331, then 2336, 2345, 2350, and then 2356-2368. If there is no major positive, the probability of gold prices rising above 2387 this week is small.
If the "mission" of gold prices last week was to test the "green and red lines" drawn by our daily chart, then this week gold needs to first pay attention to the angle range formed by the red line and the long yellow line on the daily chart above. If there is a break in this range, the upper resistance needs to pay attention to 2377 and 2387; if the red line support is broken, then pay attention to whether to hold the 2286 support. If the upper or lower edge of the 2387-2286 range is not broken, the daily chart level enters a new stage.
In this week's fundamentals, there is also a bunch of US economic data, but a report by the Federal Reserve may become a "dark horse" that affects the market: Wednesday New York time (Beijing time 27, 04:30) The Federal Reserve released the results of its annual bank stress testing. Since the Fed's high interest rates have put significant pressure on banks, the report may attract special attention from the market. If the results show that the proportion of banks meeting the standard is very high, it may trigger the concern that the Federal Reserve will delay interest rate cuts and suppress non-US assets such as gold prices. If the stress testing results show that a large proportion is at risk, it may trigger the prediction that the Federal Reserve will cut interest rates as soon as possible, which will help to lift the price of non-US assets such as
This week (0624-0628 the week) focuses on events
Monday, June 24: Without any particularly important indicators, the market may digest weekend news and follow technical signals.
Tuesday, June 25th: 14:00 UK Quarter 1 GDP, 20:30 Canada May CPI, New York time (Beijing time the next day 02:10) Federal Reserve Governor Bowman delivered a speech.
Wednesday, June 26th: 09:30 Australia May CPI, 14:00 Germany July Gfk Consumer Confidence Index, 22:00 US May New Home Sales, 22:30 US Weekly EIA Crude Oil Inventory. New York time (Beijing time on the 27th at 04:30) The Federal Reserve announced the results of the annual bank stress testing (see above for related prospects)
Thursday, June 27:17:00 Eurozone June Economic Sentiment Index, 20:30 US Quarter 1 GDP and US Initial Jobless Claims Data and US Durable Goods Orders
Friday, June 28:07:30 Japan June Tokyo CPI, Japan unemployment rate, 14:00 German retail sales, 15:55 German unemployment rate, 20:30 US May personal expenditure and PCE price index and Canada GDP, 22:00 University of Michigan consumer confidence.
Please indicate the source: https://www.daoctech.com/fxnews/1210.html
Disclaimer: The content of this article does not represent the views of the Institute of Foreign Exchange. The content is for reference only and does not constitute investment advice. Investors operate accordingly at their own risk.