
How is the MACD indicator applied?
What isMACD indicator?
MACD is the moving average convergence and divergence. It is mainly used to judge the intensity, direction, energy and trend period of price or index changes, so as to better grasp the timing of buying and selling. The MACD indicator is composed of two curves and a set of red and green bars. The more volatile of the two curves is the DIFF line, and the more gentle is the DEA line. The red and green bars are MACD bars. The MACD bar value represents twice the difference between the DIFF value and the DEA value. When the MACD value is positive, it is expressed as the red bar above the zero axis. When the MACD value is negative, it is expressed as the green bar below the zero axis.
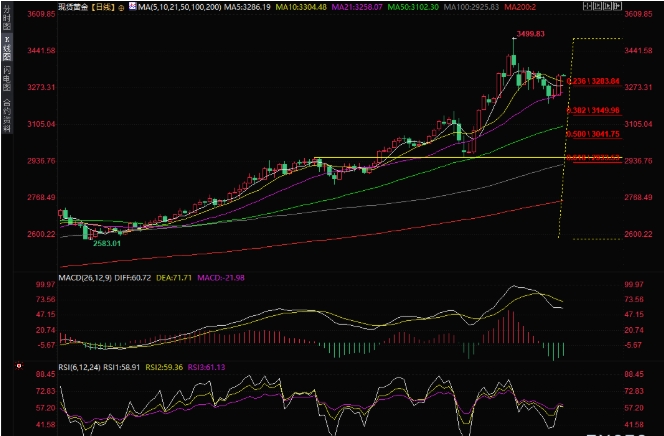
The meaning of the MACD is basically the same as that of the double moving average, but it is more convenient to read. When the MACD turns from negative to positive, it is a buy signal. When the MACD turns from positive to negative, it is a sell signal. When the MACD changes at a large angle, the gap between the fast moving average and the slow moving average widens very quickly, representing a shift in the general trend of the market.
In the application of MACD, the fast (generally 12 days) moving average and the slow (generally 26 days) moving average should be calculated first. These two values are used as the basis for measuring the "deviation value" between the two (fast and slow lines). The so-called "deviation value" (DIF) is the 12-day EMA value minus the 26-day EMA value. Therefore, in a continuous rally, the 12-day EMA is above the 26-day EMA. The positive deviation value (+ DIF) in between will become larger and larger. On the contrary, in a decline, the deviation value may become negative (-DIF), and it will also become larger and larger. As for the market starting to turn around, the positive or negative deviation value must be reduced to a certain extent to really signal the market reversal. The inversion signal of the MACD is defined as the 9-day moving average (9-day EMA) of the "difference deviation".
MACD exponential moving average convergence and divergence are two long and short smooth averages.
The trading principles are:
1. DIF and MACD are above 0, and the general trend is a long market. DIF breaks through MACD upward and can be bought; if DIF falls below MACD, it can only be used as the position squaring of the original order and cannot enter the market with a new sell order.
2. DIF and MACD are below 0, and the general trend is a short market. DIF falls below MACD and can be sold; if DIF breaks through MACD upward, it can only be used as the position squaring of the original order and cannot enter the market with a new order.
3. Formula: Yellow line (DIF) = 12-day smoothed moving average of the closing price minus 26-day smoothed moving average.
White line (DEA) = 9-day moving average.
The MACD indicator is a technical analysis tool created in the late 1970s to track the movement of stock prices. The MACD indicator is relatively simple in structure compared to other indicators, and it is the indicator that follows the trend for the longest time among all indicators except the moving average. Therefore, it is widely used in financial products around the world.
Please indicate the source: https://www.daoctech.com/fxnews/1601.html
Disclaimer: The content of this article does not represent the views of the Institute of Foreign Exchange. The content is for reference only and does not constitute investment advice. Investors operate accordingly at their own risk.