
OPEC + production increases are weakening, so why are oil prices rebounding?
In the past five trading days, US crude oil (WTI) has fluctuated downward, with a cumulative decline of more than 5%. On Monday, it rebounded by more than 2% during the session, and then gave up most of its gains. On Tuesday (September 9), the Asian session held steady at around $62.40/barrel, and the market is increasingly worried about short-term crude oil oversupply. As OPEC + continues to emphasize the need to gradually increase production in the next few months, crude oil selling pressure may continue, and US crude oil prices remain bearish.

What's next for OPEC +?
OPEC + held its latest meeting in video format on Sunday, with the participation of eight of its most influential members. The group decided to maintain a gradual production increase strategy, approving a daily increase of 137,000 barrels from October.
Although modest, the adjustment, which overlaps planned increases over the past four months, marks the gradual unwinding of the 1.60 million-barrel-a-day cuts that will last until 2026, meaning more steps are needed to fully reverse the scale of the cuts.
The decision comes against the backdrop of interest rate cuts by the world's leading central banks, which have underpinned the economic recovery and provided room for oil supply growth. At the same time, OPEC + is designed to deal with the sharp increase in US crude oil production and ensure that the group is no less than its main rival in the global energy market.
But delegates stressed that the future pace of production increases would depend on changes in global demand. While the roadmap still points to an increase in production, the group will reserve flexibility to adjust the pace if consumer demand fails to keep up. This flexibility shows that OPEC + is aware of the risk of oversupply and its potential impact on international oil prices.
The market had widely expected another increase, but what stood out was the scale: the increase approved this time was well below the 547,000 barrels per day in September. This suggests that the increase is weakening, raising questions about the sustainability of the strategy. For now, the more modest adjustment has helped US crude stabilise at around $62 a barrel after its recent decline, but the outlook remains fragile: downward pressure could intensify if OPEC + takes a more aggressive stance at a follow-up meeting.
Is the market position shrinking?
The recent decline in the net long to unpositioned squaring ratio (NP/Oi) of crude oil futures and options has stabilized at around 1.1. This decline reflects an increase in the share of short positions, mainly due to the entry of new sell contracts into the market. The move meansIncreased hedging of downside risks and increased speculation on falling oil prices。
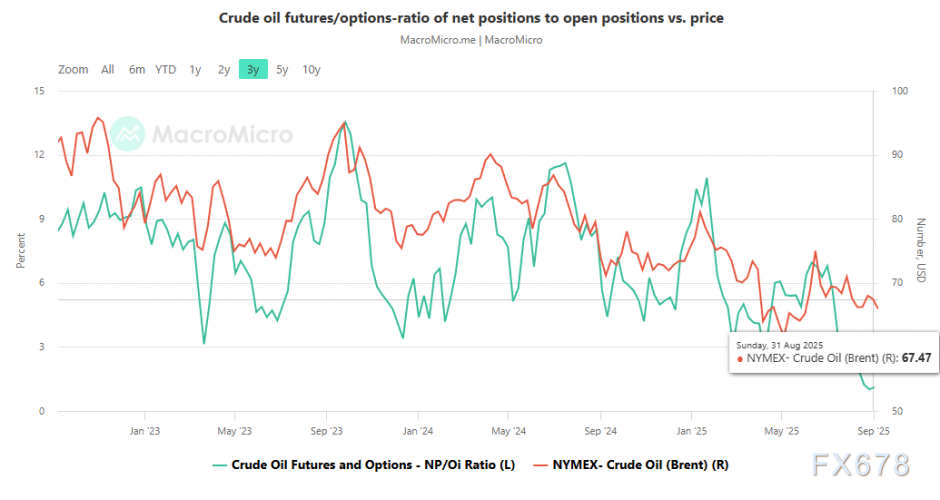
At the same time, the downward trend may also be related to long position squaring, confirming the general selling tendency in the crude oil market. If the ratio continues to decline in the next few trading days, it may indicate that the selling activity will intensify or buyers will gradually leave the market, which will further weaken confidence in US crude oil in the short term and may trigger stronger selling pressure.
Crude Oil Technology Outlook
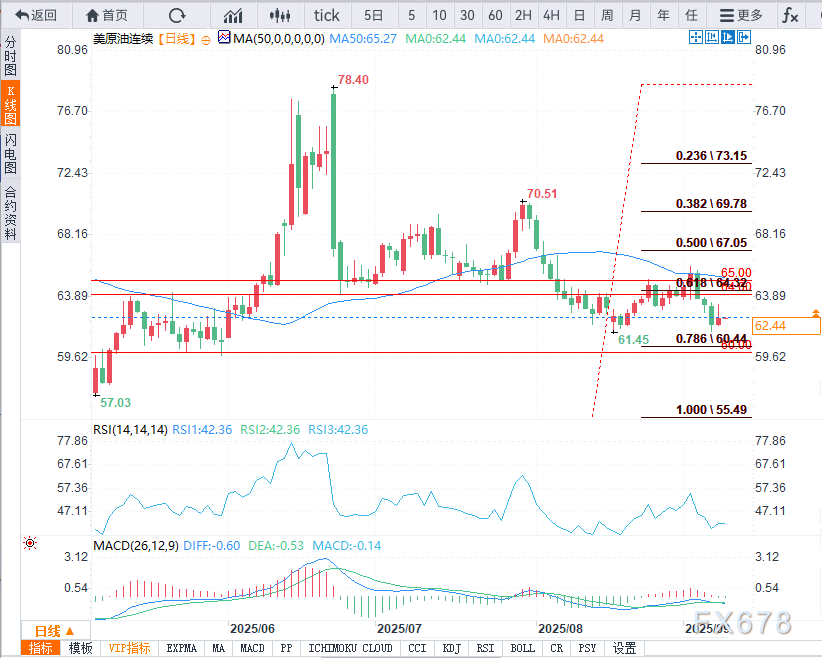
(U.S. crude oil continuous daily chart, source: Internet)
Despite a small rebound in the recent trading session, WTI still maintains a selling trend and bearish momentum continues. If prices fall below new lows, it may open the way for a clearer downtrend in the short term.
The RSI indicator maintained a downward slope and continued to hover below the neutral value of 50, confirming the dominance of selling momentum over the past 14 sessions. If this trend continues, selling pressure could further intensify.
The MACD bar chart is still in negative territory, indicating that the short-term moving average momentum remains bearish, strengthening expectations of subsequent weakness in oil prices.
Key Location:
$65 - Key resistance level: Coincident with the 50-cycle simple moving average. A sustained break above this level could trigger a short-term bullish move.
$64 - Current resistance level: associated with the 61.8% Fibonacci retracement level. As long as prices remain below this level, bearish tendencies will continue to dominate the market over the next few trading days.
$60 - Key support level: Psychologically important level, coinciding with the May low. If the price drops to this area, it may confirm the start of a sustained bearish trend under stronger selling pressure.
At 9:16 Beijing time, US crude oil was reported at $62.41/barrel in a row.
Please indicate the source: https://www.daoctech.com/fxnews/1756.html
Disclaimer: The content of this article does not represent the views of the Institute of Foreign Exchange. The content is for reference only and does not constitute investment advice. Investors operate accordingly at their own risk.