
5.29 Gold trend analysis operation, gold is volatile today, rising and stepping back more
News interpretation:
On Saturday (May 27), as expectations that the Federal Reserve will raise interest rates again heat up, the dollar may be boosted later, because the core PCE data may show that core inflation has not declined as quickly as the Federal Reserve hoped. So we can see that the Federal Reserve's attitude of raising interest rates has been strengthened, which is undoubtedly a bearish amplification for precious metals such as gold. The market generally expects that the debt crisis will be resolved, and the Federal Reserve will still tighten monetary policy in general, which is expected to put some downward pressure on gold. However, in view of the debt ceiling crisis (even if there is a solution) and the ongoing banking crisis, the Federal Reserve may suspend interest rate hikes at the next meeting, which also has to be guarded against. Looking ahead, the US debt ceiling negotiations will continue to be the focus of the market, which will expire as early as early June. In addition, the US April durable goods orders and the core PCE price index (the Fed's preferred inflation measure) will also be closely watched when they are released later in the day
Gold trend analysis:
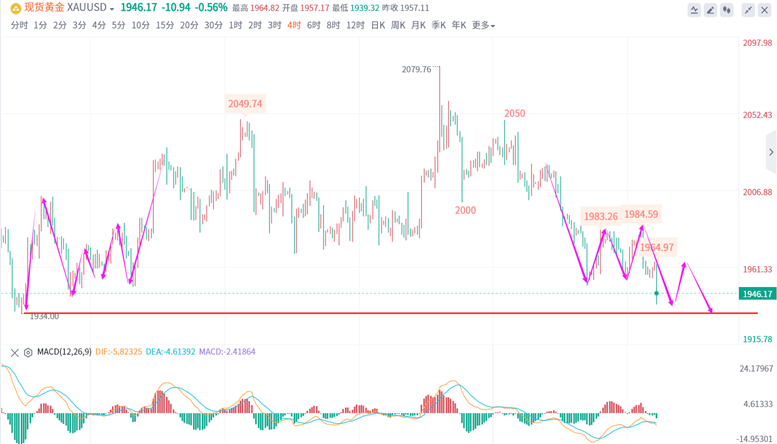
From a technical point of view, this week the price of gold experienced a period of pressure decline in 1985, falling as low as $1936. Overall, the price of gold is showing a bearish trend. The daily chart shows three consecutive negative lines. The KDJ indicator is overbought and running in the overbought area below the 20 draw line. The MACD indicator continues to hit the green column, and the fast and slow line is running downward. This all indicates that the overall trend is bearish. However, despite the overall bearish trend, we should also pay attention to some short-term rebound signs. The KDJ indicator shows oversold conditions, which may indicate the possibility of a rebound in the short term.
Looking at the overall trend, the resistance level above gold is located in the pressure area of $1965-1960. If the price of gold can stabilize and break through this level, then the next focus will be on $1980-1990. This area is considered a key resistance level, and if the breakout is successful, it may bring more upward action energy to the price of gold. If the price of gold fails to break through the above resistance level, the support area below also needs our attention. Currently, the key support level is around $1935-1933. If the price of gold breaks through this support level, it may trigger a further downtrend, directing attention to the support area near $1915-1900.
The short-term view is that gold is still in a short downward trend, and the operation continues to maintain a rebound layout short orders. At present, the rebound momentum of gold prices can be relied on to be bearish at the high point of 1965-1960 US dollars, which used to be a resistance level for gold prices. The lower support level of 1935-1933 is a bullish signal. This support level has shown strong support in the past few retracements, with the upper resistance focusing on 1965-1960 US dollars and the lower support on 1935-1933 US dollars.
Gold short-term strategy reference:
Suggested Rally Touch 1965-1963 Short, Stop 1972, Target 1950-1945 Near, Suggested Touch 1940-1942 Long, Stop 1935, Target 1950-1960 Near
Please indicate the source: https://www.daoctech.com/fxnews/320.html
Disclaimer: The content of this article does not represent the views of the Institute of Foreign Exchange. The content is for reference only and does not constitute investment advice. Investors operate accordingly at their own risk.