
The dollar is falling, and gold is waiting to break: range or trend is determined by data
On Thursday (August 28), spot gold continued to rise for the third consecutive day, and the US market fluctuated around the first-line high of $3,406 before the market, approaching a new high in more than two weeks. The overnight drop in the dollar and the yield of US bonds provided external conditions for gold prices to continue to rise; the current price is still near the key resistance area, and the market turned its focus to a package of US data released at 20:30 Beijing time tonight (12:30 GMT).

Fundamentals
The US dollar index hovered around 98.00, still locked in the narrow range of the month, and the weak structure has not changed. On the interest rate side, the 10-year yield fell to about 4.23%, the 30-year remained near 4.91%, and the 2-year returned to 3.62%. The term structure continued to compress downward; the more critical 10-year inflation-protected bonds (TIPS) real yield fell back to 1.79%, reducing the opportunity cost of holding non-yielding assets and providing real support for precious metals. At the level of interest rate expectations, the CME tool shows that the implied probability of a 25bp interest rate cut in September is about 87%, and the cumulative easing of about 50bp during the year is still the market baseline. At the Jackson Hole meeting, the Federal Reserve Chairperson's statement that "conditions may require" easing policy further solidified easing expectations. At the same time, controversy over central bank independence and uncertainty about the economic outlook have strengthened demand for safe havens.
In terms of the data agenda, the second estimate of US GDP in the second quarter, the GDP deflator, the core PCE in the second quarter (annualized quarter-on-quarter, preliminary value) and the number of initial jobless claims for the week will be released tonight at 12:30 GMT. The market consensus expects the core PCE to rise to 2.6% (previous value of 2.5%), the annualized GDP growth rate to rise to 3.1% (previously 3.0%), the deflator to maintain 2.0%, and the initial request or fall back to 230,000 (previously 235,000). These readings will provide a new anchor for economic resilience and inflation stickiness, and directly affect the pricing of the path for the September meeting and beyond; the monthly PCE inflation released on Friday remains the "fixed star" of sentiment this week.
Technical aspects:
The daily chart shows that the Bollinger middle rail is located at 3352.94, the upper rail is 3419.71, and the lower rail is 3286.17; the current price of 3406.62 is still running close to the upper rail. In the past month or so, the price has been tugging between the upper rail and the middle rail, and the whole is an upper edge fluctuation under the sideways trend. Two significant highs can be seen in the figure: 3451.14 and a higher 3499.83, corresponding to the upper stock lock-up area. The width of the Bollinger band has obviously converged and formed a phased "Bollinger belt squeeze". The price has approached the upper rail many times but has not achieved an effective breakthrough, indicating that the bulls have sufficient momentum but lack a foot in the door.
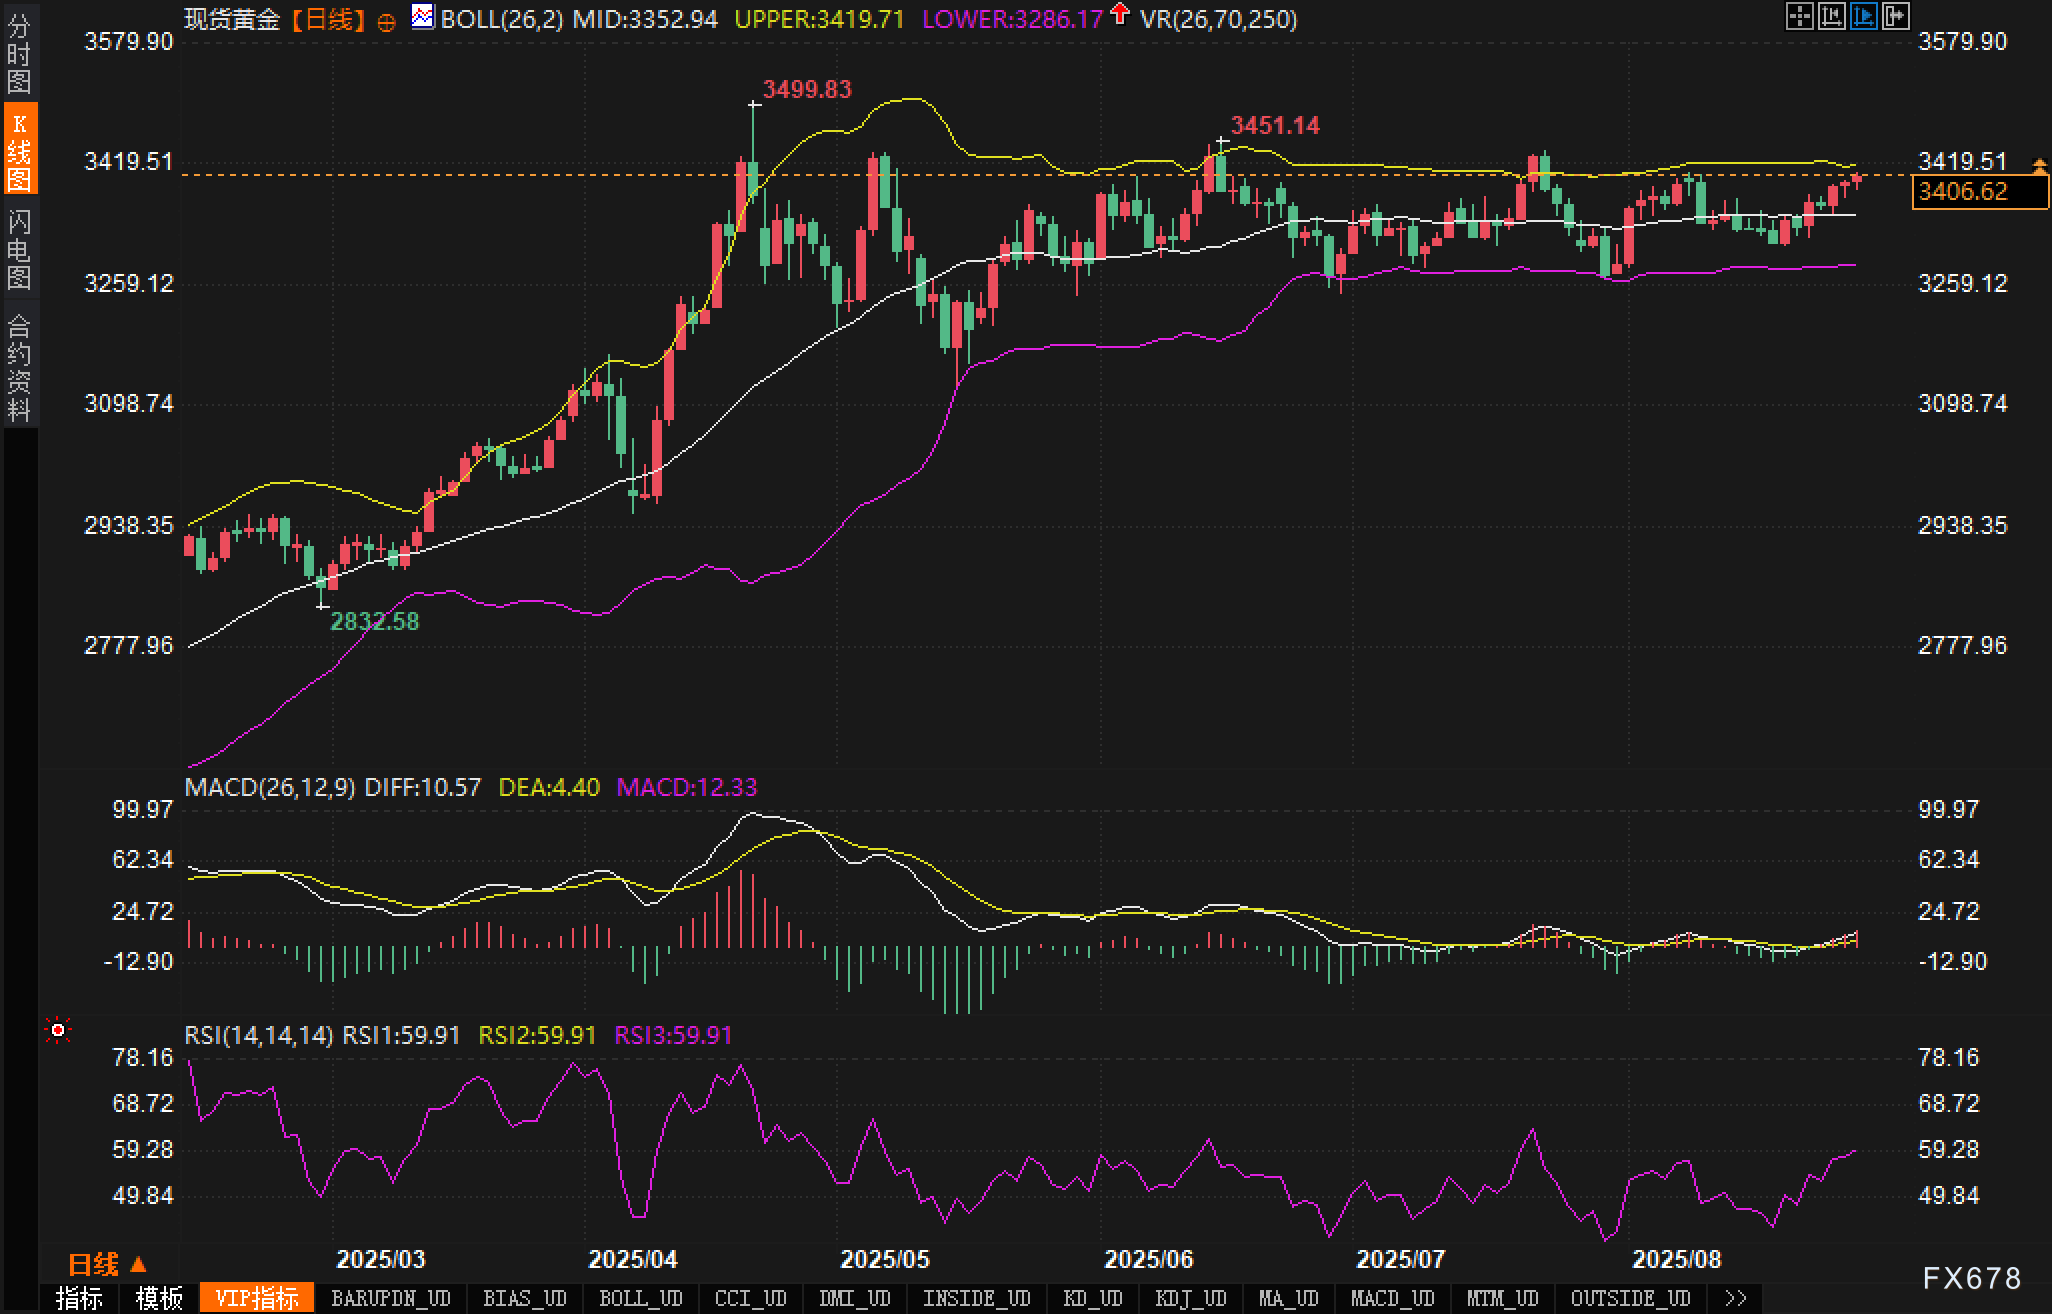
In terms of MACD, DIFF = 10.57, DEA = 4.40, the two maintain a golden fork, and the bar chart is + 12.33. Although the intensity is not an explosion, the positive momentum is still slowly accumulating; if the subsequent column continues to expand and the positive line of the price entity closes above 3419.71, it can be regarded as a trend confirmation signal of "quantity energy breakthrough" type. The relative strength index RSI (14) was 59.91, which is in the middle and high but far from the extreme. It belongs to the momentum range of "healthy strong" and resonates positively with MACD.
At the static price level, the resistance is 3419.71 (Bollinger upper rail/recent intensive pressing), 3451.14 (stage high), and 3499.83 (year high); the support is 3385-3390 (upper back-testing area), 3352.94 (Bollinger middle rail/dynamic support), 3320 first line (intensive trading area), and 3286.17 (Bollinger lower rail/key support), which will determine the rhythm of the midline.
Market Sentiment Watch
Since the beginning of this week, the bullish market sentiment of precious metals has been repaired while walking, but there is no sign of overheating. The dollar is at the bottom of the range, and nominal interest rates and real interest rates have fallen in tandem, forming a pricing framework of "three resonances": one is the passive rise of the foreign exchange side, the other is the reduction of the discount rate caused by the downward shift of the yield curve, and the third is that concerns about the independence of central bank policy and the resilience of long-term inflation provide a hedging premium. From the perspective of options, implied volatility is in a low range, combined with the Bollinger Band squeeze, which means that the time window for "low volatility contraction - high volatility release" is approaching; once the data unexpectedly triggers direction selection, volatility has a tendency to rise.
At the level of group psychology, bearish psychology has begun to increase, and the divergence of views between trend trading and swing trading has increased, but the overall bull market sentiment is dominant but not overheated, and the typical reflexive signal of "market peak" has not yet been seen. The contrarian indicators that need to be vigilant mainly come from the short-term rebound of the dollar and the sudden recovery of real interest rates. Once they appear, they will quickly compress the momentum advantage of gold prices.
Please indicate the source: https://www.daoctech.com/fxoutrade/1731.html
Disclaimer: The content of this article does not represent the views of the Institute of Foreign Exchange. The content is for reference only and does not constitute investment advice. Investors operate accordingly at their own risk.