
A Practical Study on the Relationship between Moving Average and Trend
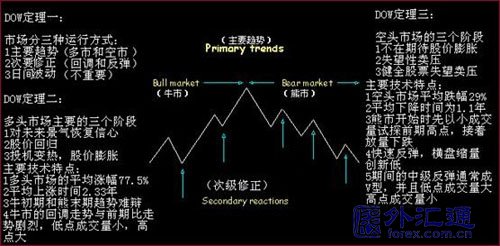
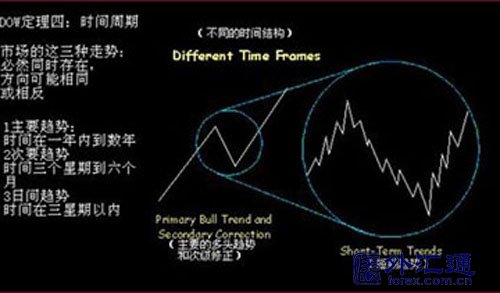
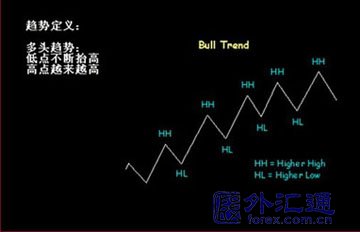
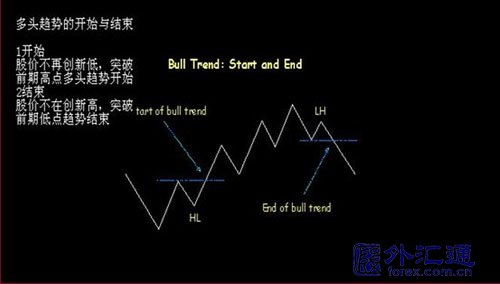
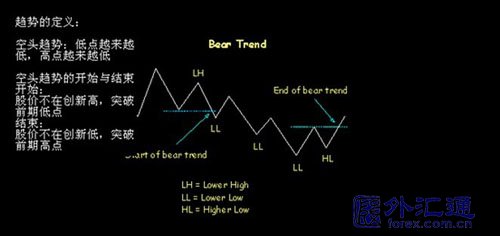
EMA and trend
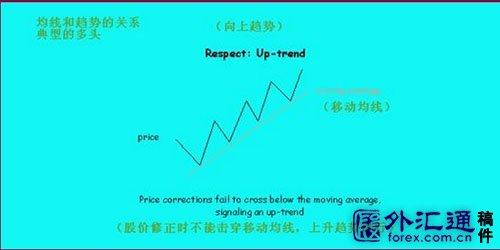
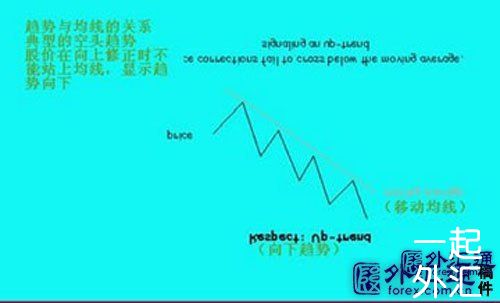
Actual legends of trends and moving averages
In particular, the trend's 123 and 2B law averages are well represented.
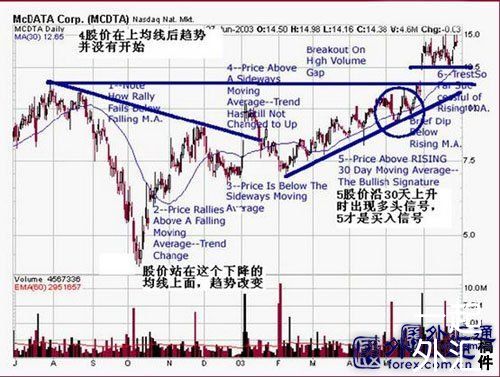
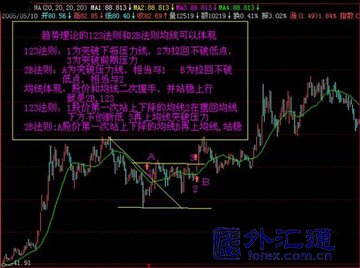
Through the analysis of the above three moving average trading systems, the combination of the two moving averages can best reflect the trend and follow the trend. Foreign data also show that the two moving averages are the best combination.
Based on the above research, we can make the following points
A) The principle of short and long lines reflecting trends: The combination of two moving averages (short-term and long-term) best reflects the trend, as we know through the review of trend theory. Long-term influences short-term, short-term influences long-term, and this combination of moving averages reflects the short-term trend very well. Follow and influence the long-term trend.
B) Moving average period combination principle, long-term 250. Medium-term 120, short-term 60, these three numbers conform to the cycle description of trend theory. In actual use, it can be adjusted to (20X X) (12X X) (6X X) X represents the number that can be adjusted by yourself. X also represents the short-term moving average. Whether it is 3, 5, or 10, you decide.
Next, let's look at the two-line and periodic principles through examples
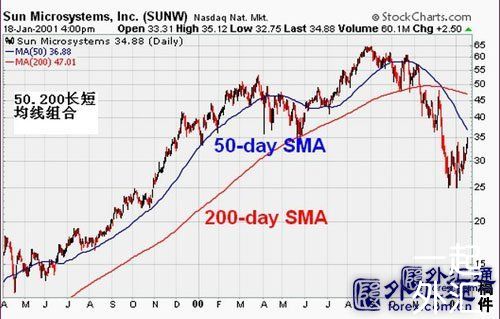
1. The combination of short and long lines of the moving average effectively reflects the trend;
The two-cycle principle of the moving average can effectively reflect trends.
Let's look at the theoretical analysis of these two principles of the moving average
As far as technical indicators are concerned, the moving average is a good price analysis tool. It faces the price head-on and chases the trend; it is not easy to set deception lines, has good directionality and the role of boosting and falling, and can filter false breakout signals. But it has no fixed sampling pattern and always lags behind the current price movement.
The so-called short-term principle is to sample a short time and a short period of time. In terms of price analysis, the short-term moving average is the main one. Because only in this way can the lag of the moving average be reduced as much as possible.
In terms of sampling, we cannot stick to the previous sampling mode. Scientific sampling methods are determined according to market characteristics and risk. For example, the ten-day line is a short line in the stock market, while it is used as a medium line in the futures market. When the price changes greatly, the sampling range should be reduced, and vice versa should be increased.
The so-called long-term principle can effectively reflect the trend
How to trade with moving averages is what we are most concerned about. The most famous trading method is Gruger's Law. But it has at least two flaws,
First, it ignores the influence of different moving averages in the short, medium and long term on prices (what the second-line principle should avoid).
Second, it is always buying and selling, with no time or price range to avoid or wait and see.
We believe that when the moving average is up and the price moves above the moving average, it is always the stage of opening, buying and holding positions. When the moving average is down and the price moves below the moving average, it is always the stage of opening, selling and holding positions.
When the moving average is up and the price moves below the moving average, or when the moving average is down and the price moves above the moving average, it is the stage of position squaring.
This evasive and wait-and-see attitude is at least desirable, indicating that we have the courage to admit that we do not understand the market and do not dare to make transactions.
This is consistent with the idea that price determines the moving average and not the moving average determines the price. A trading system without wait-and-see and avoidance is not a perfect trading system.
An excellent trading system does not limit profits, but limits losses. Adhering to the short-term principle, although it cannot guarantee profits, it can greatly limit losses.
We can see from the above analysis and actual comparison that the moving average is a trend, and the two-line principle and the two-cycle principle can be used to achieve the trend we want to trade. It should be called the king of indicators, and there is no consolidation trend here. Note that the cycle of each stock is different, but it should be a long-term combination.
Conclusion: The moving average reflects the trend theory with its performance.
From the above analysis, we can draw the conclusion that both trend research and trading averages can be reflected. Specifically, there are four points:
1. The moving average reflects the pressure and support of the trend.
The moving average trading point conforms to the laws of 123 and 2B.
3. The moving average of the two-line combination reflects the trend and is used for trading.
4. The different cycle settings of the moving average reflect the individuality of each stock.
Please indicate the source: https://www.daoctech.com/fxoutrade/2018.html
Disclaimer: The content of this article does not represent the views of the Institute of Foreign Exchange. The content is for reference only and does not constitute investment advice. Investors operate accordingly at their own risk.