
DIBS Forex Trading Method
In order for trading to generate profits, foreign exchange traders must develop workable trading strategies through trial and error. We also have different personalitiesforeign exchange marketAfter trading, we may generate very different trading styles that generate profits. At the beginning of your trading career, it may be difficult to form a foreign exchange trading strategy until you master it. Although it is not recommended, you can try to replicate another successful trader's strategy for at least a while.
Of course, the most successful traders are also the best in the industry, working with investment banks and hedge funds. Peter S. Kraus is a good example. He worked at Goldman Sachs for 22 years. He came up with the DIBS trading method, which has a daily internal bar setting.
How the system works
This trading strategy is mainly suitable for technical analysts, although it is not limited to others. The rationale behind this system is to buy an asset when it goes up and sell it when it goes down; in this case, the asset is a specific currency.
Now the question is, how do you know when to go up or down? It's simple, just compare the opening price of the day to the previous closing price at 6:00 GMT. To do this, we first need to define an inbound daily line, which is a graph formed by the K-line, before the K-line is completely engulfed by the previous K-line, such as the example below. This pattern is characterized by market uncertainty, providing an opportunity to buy or sell when market conditions turn bearish or bullish.
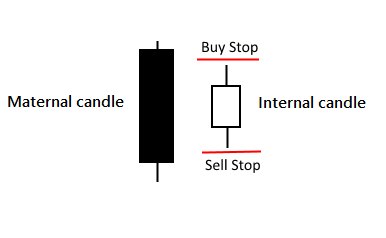
At the beginning of the trading day, once you have determined the time to reach 6:00 GMT, switch to the H1 time period and observe the change of the candlestick chart for that day. Since this chart is uncertain, you will also need a supporting indicator to give you some hints of the market situation, and a good indicator can become a moving average. Add a simple moving average to your Forex chart, this will give you a sense of the direction of the market, if the price is above the SMA, the market is bullish and vice versa.
Now that you understand the situation of the market, the same internal bar chart will let you know when to enter and leave the trade. Once the engulfed K-line, closed above or below the SMA, make the corresponding buy or sell order operation, do not forget, risk management. In the buy order, the stop loss should be lower than the engulfed K-line body, in the sell order and vice versa. The gain obtained should have a profit margin of at least 1:1, or if you are bold enough, you can make a stop loss eventually to help you capture the whole trend.
Preventive measures
Ensuring that the lines and bars of the K-line are completely engulfed by their predecessors is the only way to identify market instability.
The K-line should trade above or below the moving average, not within the SMA line. The SMA line should suggest the situation, while the K-line trend line is more indicative of uncertainty.
Make sure to check for any news that could affect the currency pair you are interested in. Any key news announcement could completely change the trend and render strategy meaningless.
The advantages of the DIBS approach
Although Peter Kraus recommends using the DIBS method for the H1 timeframe, the same procedure can be used for most other timeframes, including the M15, M30, H4, and daily timeframes. However, when using this method for higher timeframes, such as the daily and H4 timeframes, you may have to adjust the opening time from 6:00 (GMT) on the day to 6:00 (GMT) on the Monday of the week. This makes the strategy very flexible and versatile, suitable for a variety of traders, whether they are long-term swing traders or scalpers looking for quick returns.
In addition to being flexible, it is also quite accurate. There is no 100% profit strategy, and no one will tell you they are bluffing or trying to, scam, you. But the DIBS strategy is accurate most of the time, as it catches breakouts when the big players in the market make trades, while generating huge profits from rapid price changes.
There are also great benefits to this way of trading, the graphs can often be spotted within 6 to 9 hours of the start of the trading day. The 6:00 (GMT) trading time is right before the start of the London meeting and overlaps with the subsequent Asian and US meetings, and traders tend to keep the trend of their trades on the trading day. You know, when trading, every trader wants to follow the crowd, and this action creates a trend that is longer and more profitable.
Ruling on DIBS
Finally, just as with any other strategy, it is important to remember that the DIBS approach is susceptible to economic factors and individual interpretations.
This doesn't mean you shouldn't use it, but you should practice using it on your demo account before you actually invest your money. This will also give you the opportunity to figure out which timeframe and currency pair is best for you, so that your trading is more mature.
In conclusion, all traders have proven that this method is very profitable; its ease of use is just an added bonus. Most people are unaware of this method, and the strategy is still obscure, but the results speak for themselves. In addition, all the platforms offered by Forex brokers will allow you to use this strategy.
Please indicate the source: https://www.daoctech.com/fxschool/1002.html
Disclaimer: The content of this article does not represent the views of the Institute of Foreign Exchange. The content is for reference only and does not constitute investment advice. Investors operate accordingly at their own risk.