
How to apply forex technical analysis to predict price movements in the foreign exchange market?
foreign exchange marketIt is constantly changing and follows a certain cycle. If we can predict prices, then we can make money in the market. SoForex technical analysisHow can our application help us predict price movements in the foreign exchange market?
What is technical analysis?
Technical analysis is the prediction of price movements based on the analysis of the historical movement of price charts. The basic principle of technical analysis is a series of articles published by Charles Dow in the Wall Street Journal in 1900-1902. Although it is based on observations of the stock market, the theory he created is also valid in the foreign exchange market. Basically there are three assumptions.
- The market (price) takes everything into account. In the current quotes and market movements, all trends, the sentiment of participants, and other factors that may affect the current price formation have been taken into account.
- History repeats itself. Dow's observations show that market formation, such as the alternation of peaks and lows, is relatively stable and tends to repeat itself over time.
- Price trends constantly emerge and complement each other. Price movements are not random. At every point in time, there is a mainstream movement: up, down, or sideways.
Based on this, we can come to the conclusion that technical analysis is a universal means of predicting future prices.
Application of Forex Technical Analysis
From theory to practice, there are many tools for using technical analysis to predict prices. But we would like to draw your attention to the most popular and effective technical analysis tools.
linear tool
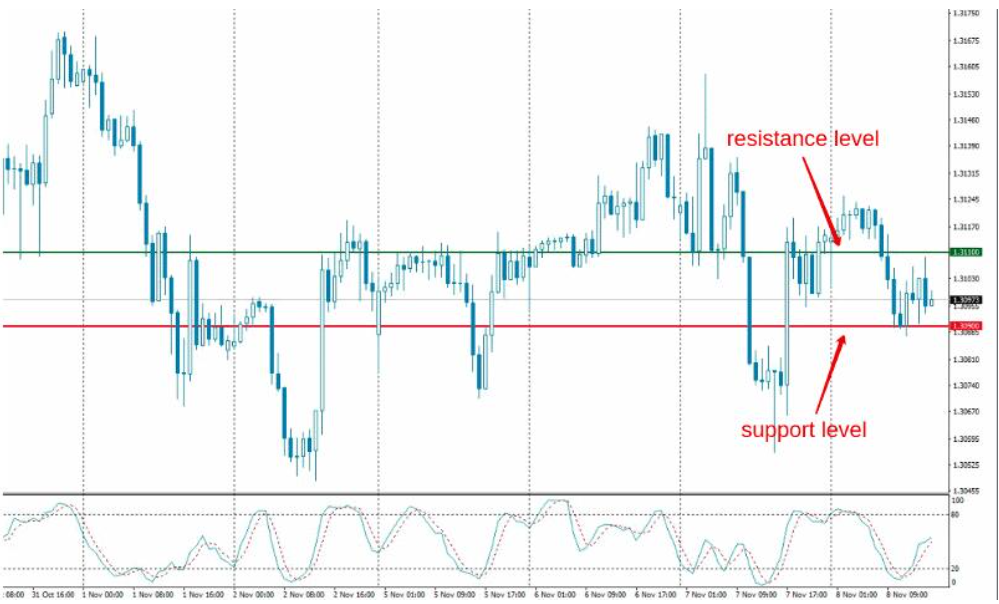
Linear technical analysis tools are represented by a set of lines: vertical, horizontal and trend. Vertical lines are a good guide to the start of a new trading session and mark the release of key coverage. Horizontal lines allow you to draw trending price channels (support and resistance lines). Breaking through these levels is often a sign of a trend change in the Forex market. Trend lines allow an assessment of the current trend.
In the chart below, we use red and green lines to show support and resistance levels.
indicator
It is a general-purpose tool that not only allows you to automatically establish various lines, waves, and levels on a currency pair chart, but also determines necessary parameters such as market conditions, the direction and strength of a trend, and even alerts you to an impending reversal.
Indicators can be considered as the main tools of technical analysis. According to the advice of professionals, the most effective are. Moving Average, Bollinger Bands, Stochastic Oscillator, MACD Bar Chart, RSI.
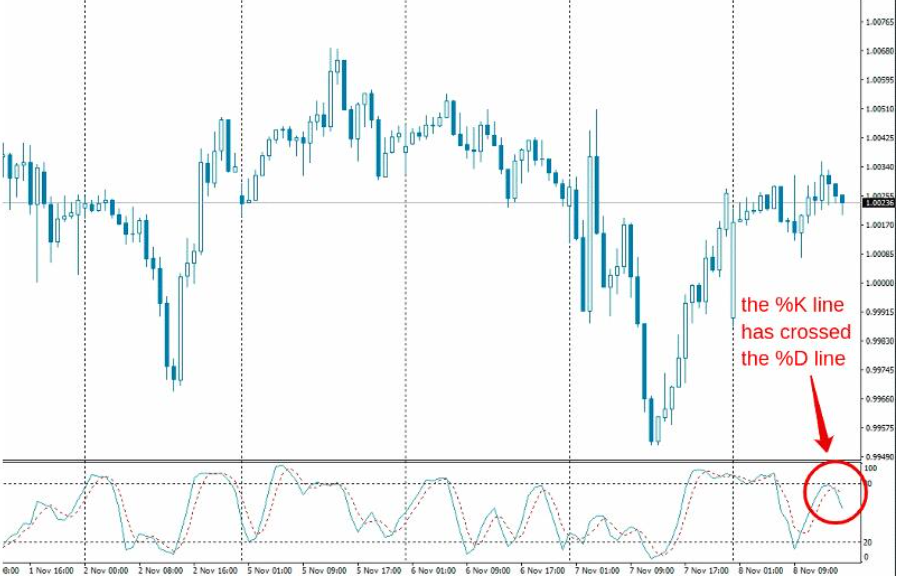
Let's look at an example: How the Stochastic Oscillator works. It is located at the bottom of the chart and consists of two curves: the% K line (solid line) and the% D line (dashed line), which move up and down in a vertical range of 0 to 100%. Starting at levels 20 and 80, there are two horizontal lines, which are located below and above the oversold and overbought zones, respectively.
Technical analysis form
Technical analysis patterns or chart patterns offer the possibility to analyze and supplement the quality of your analysis. As you know, the charts of currency pairs follow certain trends. Therefore, with the help of patterns, it is possible to predict the continuation of a trend and its reversal.
Typically, the ten basic numbers of technical analysis are applied. Triangle, Head and Shoulders, Double Top, Wedge, Triple Bottom, Triple Top, Double Bottom, Flag, Round Bottom, Pentagon. For each number, there are rules for entering the market.
Let's look at the example of a triple top. A triple top is a number from technical analysis of financial marekt (including the foreign exchange market) that is formed after a long uptrend, indicating a possible reversal of the trend.
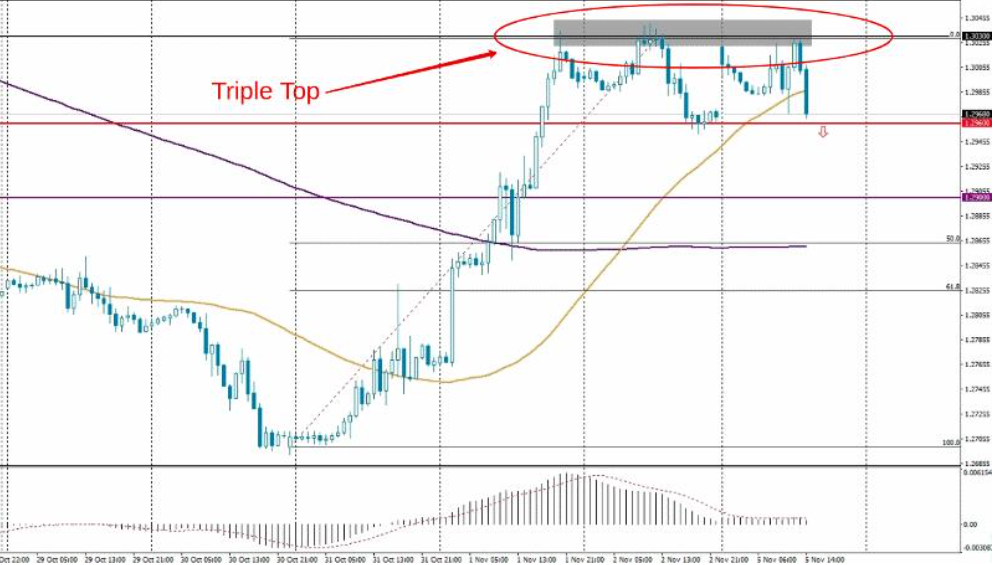
If the price falls below the support level (a specific deviation is acceptable), the formation of the model is considered complete. A sell signal appears and the direction of the trend is expected to change. Therefore, as you can see, technical analysis proposes a lot of methods, how to use its tools in practice, to predict the price movement. Everything is at your disposal.
Please indicate the source: https://www.daoctech.com/fxschool/1157.html
Disclaimer: The content of this article does not represent the views of the Institute of Foreign Exchange. The content is for reference only and does not constitute investment advice. Investors operate accordingly at their own risk.