
What is an RSI divergence indicator? How to trade with an RSI divergence?
RSI indicator M-shaped top divergence (also known as bimodal peak divergence)
The M-shaped trend of the RSI indicator is a common peak pattern in the overbought area. When both the RSI and the exchange rate are at a high level, the exchange rate shows a trend of one wave higher than the other, while the RSI shows a trend of one peak lower than the other. This is the phenomenon of the top deviation of the RSI.
The phenomenon of top divergence is generally a signal that the exchange rate is about to reverse at a high level, indicating that the exchange rate has a high probability of falling in the short term, which is a sell signal.
In the actual trend, the top deviation of the RSI indicator means that during the continuous rise of the exchange rate, the exchange rate first hit a high at ①, and the RSI indicator correspondingly hit a new high above 80 ③.
Afterwards, after a certain drop in the exchange rate, the RSI also adjusted with the falling trend of the exchange rate. However, when the exchange rate rises again and surpasses the previous high to make a new high ② ④, the RSI shock wave ④ does not follow the exchange rate to break through the previous high ③ and begins to fall, which forms an M-shaped top deviation of the RSI indicator.
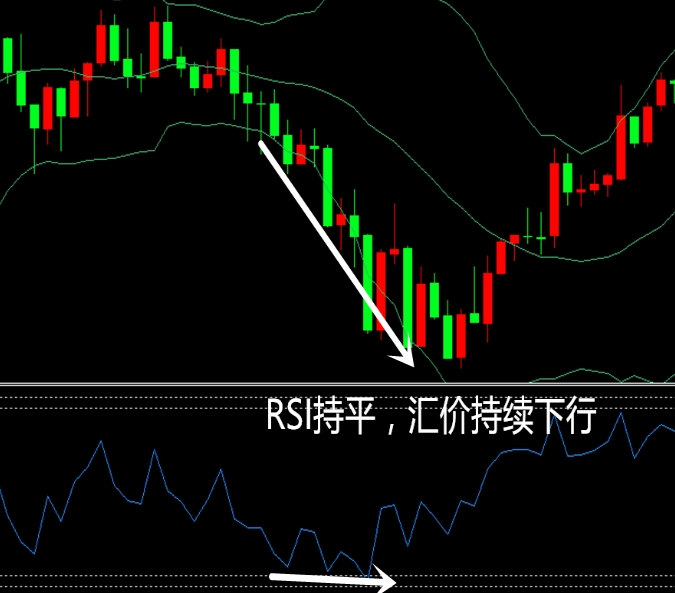
When the RSI shows an M-shaped top divergence, the exchange rate is more likely to peak and fall, which is a strong sell signal.
RSI indicator W-shaped bottom deviation
The opposite of the M-shaped top divergence is the W-shaped bottom divergence. When both the RSI and the exchange rate are at a low level, the exchange rate continues to fall, forming a wave-to-wave low trend, while the RSI shows a bottom-to-bottom high trend, this is a W-shaped bottom divergence. The phenomenon of a W-shaped bottom divergence usually means that the exchange rate may rebound in the short term, which is a buying signal.
Key points to note when using RSI indicators
(1) Making good use of RSI deviations can overcome the losses caused by the passivation of the RSI index to a certain extent, but do not rush to follow orders when deviations fail.
(2) In the RSI divergence, the accuracy of the M-shaped top divergence is higher than that of the W-shaped bottom divergence. The RSI indicator W-shaped bottom divergence usually needs to be confirmed by repeated bottom divergences several times, so M-shaped top divergence transactions should be selected as much as possible.
(3) Generally speaking, the deviation from the long cycle time will be higher than the deviation from the short cycle time.
Please indicate the source: https://www.daoctech.com/fxschool/1602.html
Disclaimer: The content of this article does not represent the views of the Institute of Foreign Exchange. The content is for reference only and does not constitute investment advice. Investors operate accordingly at their own risk.