
A picture of 18 direct foreign exchange support resistance: US dollar + European and Japanese + commodity currencies + emerging currencies (December 29, 2025)
A chart to see the direct support resistance: USD + European + Japanese + Commodity Currency + Emerging Currency, updated on Monday, December 29, 2025 at 13:40, specific USD/EUR/JPY/GBP/CHF/ANZ + RMB/HKD/RUB/Rand/Krona and other 18 straight, more details in the latest information analysis if the content of the special chart.
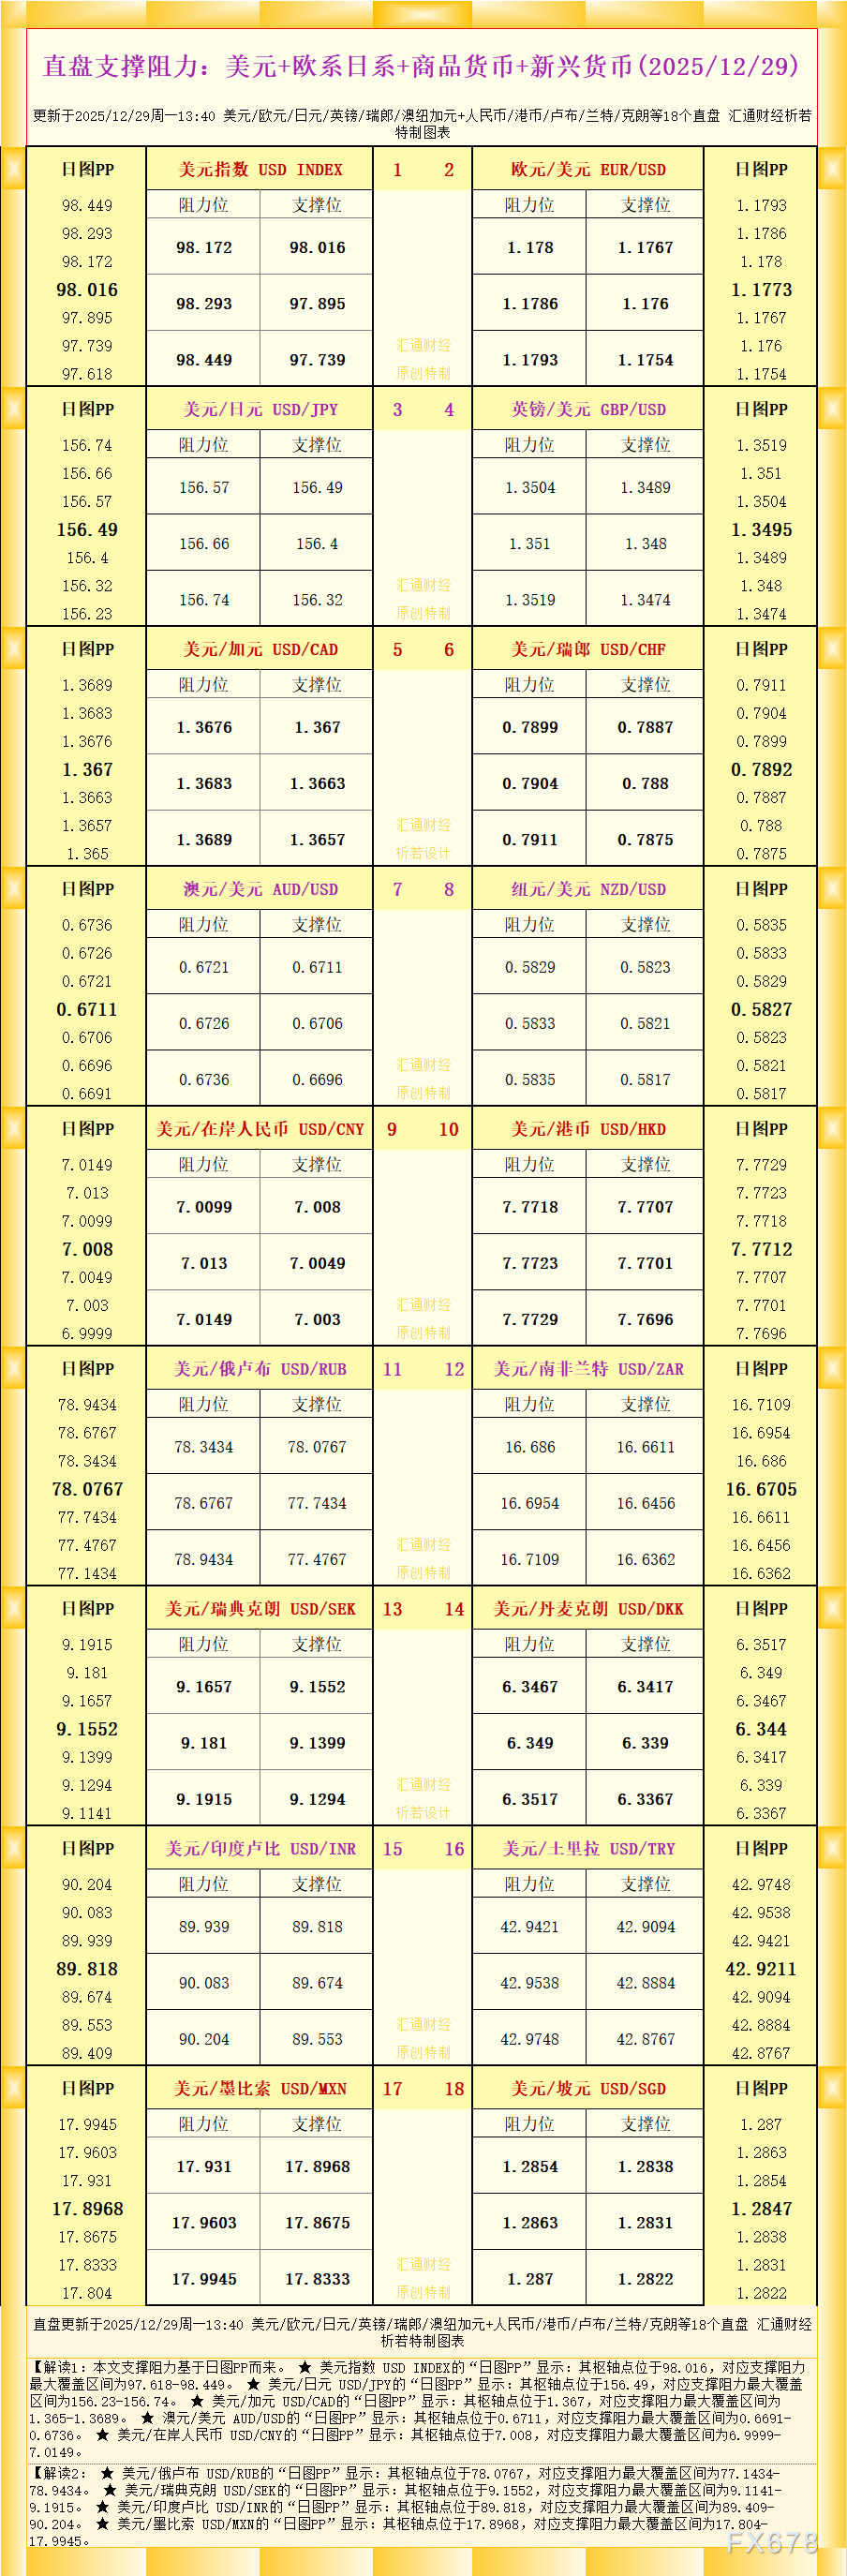
As the data in the figure shows, interpretation 1: This support resistance is based on the daily chart PP.
★ The "daily chart PP" of the US dollar index USD INDEX shows that its pivot point is at 98.016, corresponding to the maximum coverage range of support and resistance at 97.618-98.449.
★ USD/JPY The "daily chart PP" of USD/JPY shows that its pivot point is at 156.49, corresponding to the maximum coverage range of support resistance at 156.23-156. 74.
★ The "daily chart PP" of USD/CAD shows that its pivot point is at 1.367, corresponding to the maximum coverage range of support resistance of 365-1.3689.
★ The "daily chart PP" of AUD/USD shows that its pivot point is at 0.6711, corresponding to the maximum coverage range of support resistance of 6691-0.6736.
★ The "daily chart PP" of USD/CNY shows that its pivot point is at 7.008, corresponding to the maximum coverage range of support resistance at 9999-7.0149.
Interpretation 2:
★ The "daily chart PP" of USD/RUB shows that its pivot point is at 78.0767, corresponding to the maximum coverage range of support resistance at 1434-78.9434.
★ The "daily chart PP" of USD/SEK shows that its pivot point is at 9.1552, corresponding to the maximum coverage range of support resistance at 1141-9.1915.
★ The "daily chart PP" of USD/INR shows that its pivot point is at 89.818, corresponding to the maximum coverage range of support resistance at 89.409-90.204.
★ The "daily chart PP" of USD/MXN shows that its pivot point is at 17.8968, corresponding to the maximum coverage range of support resistance of 17.804-17.9945.
For more variety interpretations, please refer to the chart. The latest information is original and specially made, all rights reserved, for reference only.
Please indicate the source: https://www.daoctech.com/fxschool/2056.html
Disclaimer: The content of this article does not represent the views of the Institute of Foreign Exchange. The content is for reference only and does not constitute investment advice. Investors operate accordingly at their own risk.