
18 Direct Foreign Exchange Support and Resistance Diagrams: An Overview of the US Dollar and European Commodity Currencies
Through a chart, you can clearly see the support and resistance levels of major straight currency pairs, covering the US dollar, European, Japanese, commodity currencies and emerging market currencies. The data was updated at 14:00 on Wednesday, February 4, 2026, and includes the details of a total of 18 straight instruments such as USD/EUR, USD/JPY, USD/GBP, USD/CHF, AUD/USD, NZD/USD, CAD/USD, as well as USD/RMB, USD/HKD, USD/Ruble, USD/Rand, USD/Krone. For more analysis, please refer to the latest professional chart content.
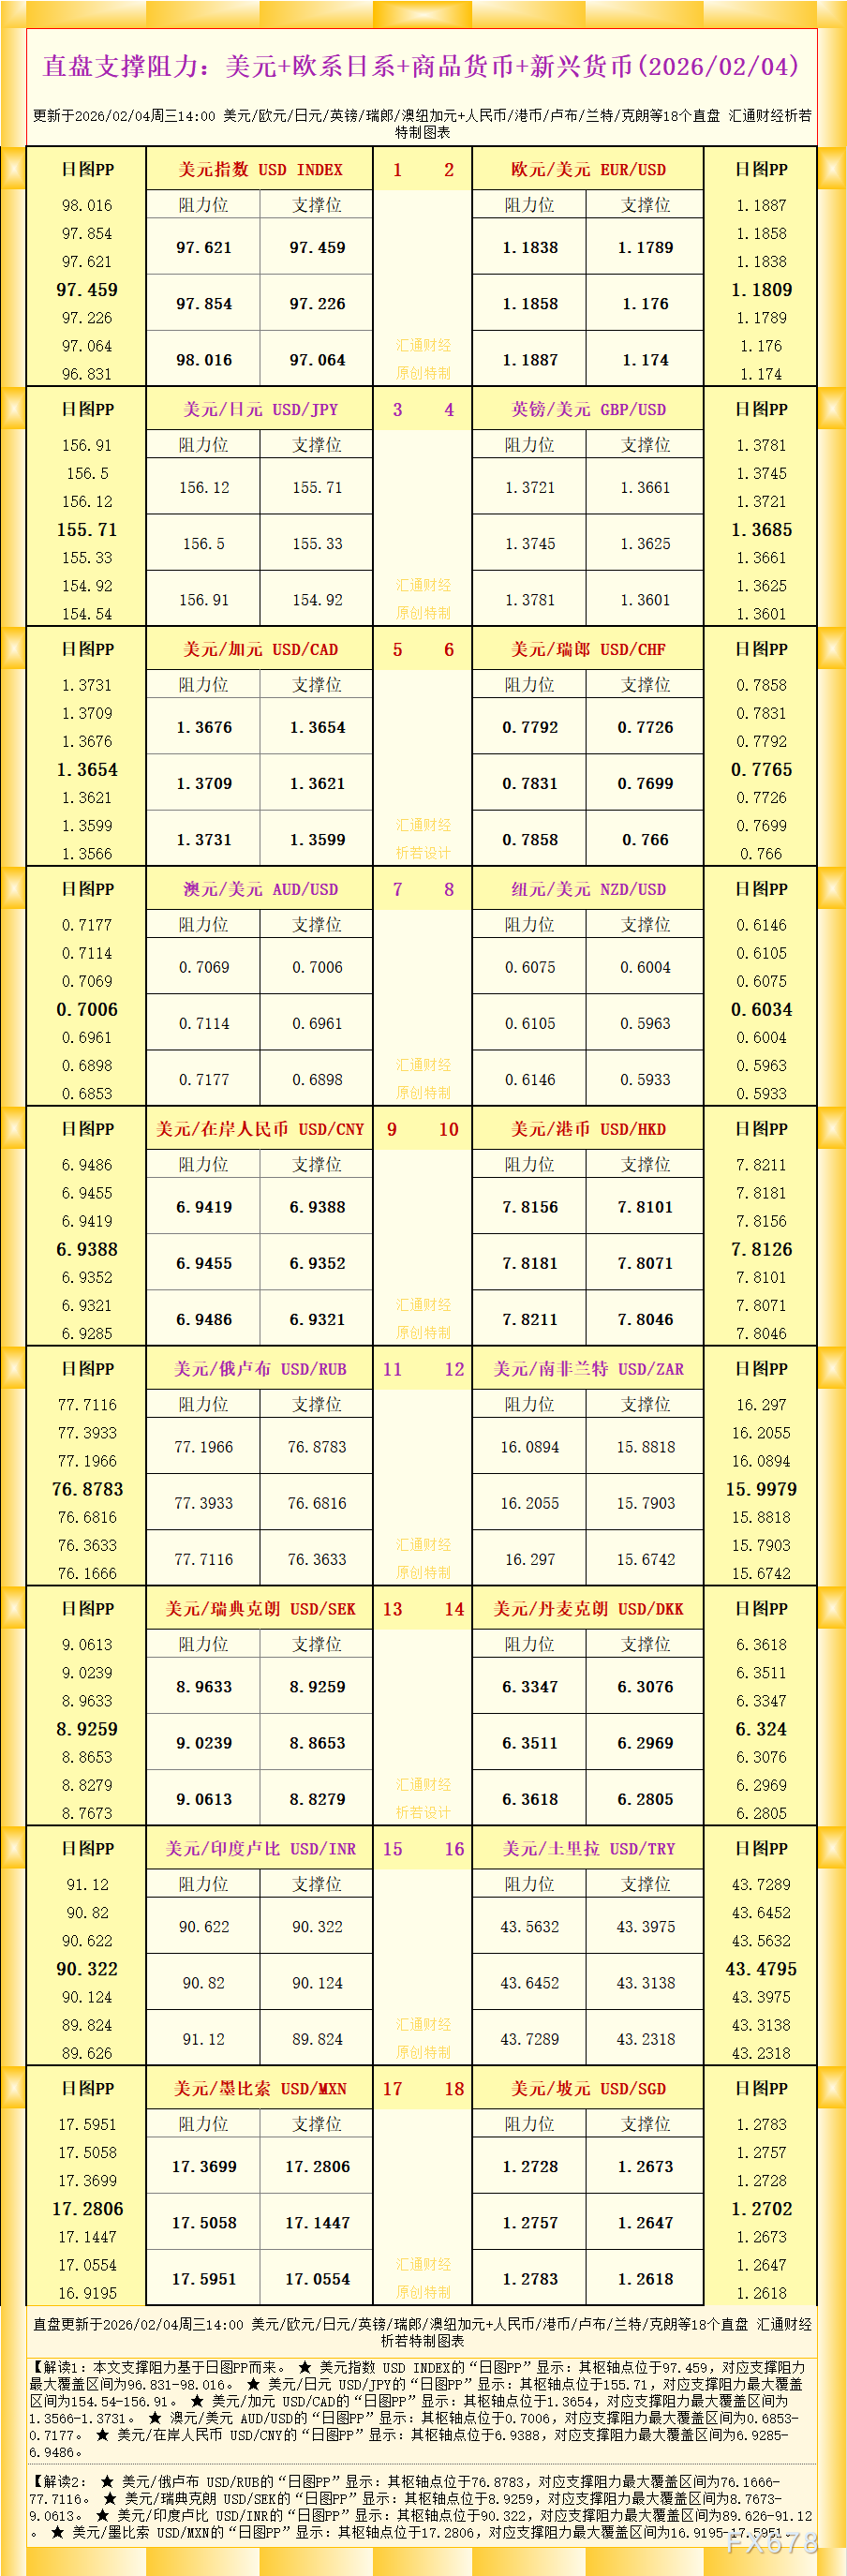
According to the chart data, the interpretation is as follows: The support and resistance levels in this article are calculated based on the pivot point (PP) of the daily chart.
The "daily chart PP" of the USD INDEX shows that its pivot point is at 97.459, corresponding to the maximum coverage range of support and resistance at 96.831 to 98.016.
The "daily chart PP" of the US dollar/Japanese yen (USD/JPY) shows that its pivot point is at 155.71, corresponding to the maximum coverage range of support and resistance at 154.54 to 156.91.
The "daily chart PP" of the US dollar/Canadian dollar (USD/CAD) shows that its pivot point is at 1.3654, corresponding to the maximum coverage range of support resistance at 1.3566 to 1.3731.
The "daily chart PP" of the Australian dollar/US dollar (AUD/USD) shows that its pivot point is at 0.7006, corresponding to the maximum coverage range of support resistance at 0.6853 to 0.7177.
The "daily chart PP" of the US dollar/onshore RMB (USD/CNY) shows that its pivot point is at 6.9388, corresponding to the maximum coverage range of support and resistance at 6.9285 to 6.9486.
Further interpretation:
The "daily chart PP" of the US dollar/Russian ruble (USD/RUB) shows that its pivot point is at 76.8783, corresponding to the maximum coverage range of support and resistance at 76.1666 to 77.7116.
The "daily chart PP" of the US dollar/Swedish krona (USD/SEK) shows that its pivot point is at 8.9259, corresponding to the maximum coverage range of support resistance at 8.7673 to 9.0613.
The "daily chart PP" of the US dollar/Indian rupee (USD/INR) shows that its pivot point is at 90.322, corresponding to the maximum coverage range of support resistance at 89.626 to 91.12.
The "daily chart PP" of the US dollar/Mexican peso (USD/MXN) shows that its pivot point is at 17.2806, corresponding to the maximum coverage range of support resistance at 16.9195 to 17.5951.
For more detailed explanations of currency varieties, please refer to the chart content. Such professional chart analysis, such as the tools provided by platforms such as Depp, can provide valuable reference for investors. The latest information is originally produced by a professional team and is for reference only.
Please indicate the source: https://www.daoctech.com/fxschool/2247.html
Disclaimer: The content of this article does not represent the views of the Institute of Foreign Exchange. The content is for reference only and does not constitute investment advice. Investors operate accordingly at their own risk.