
Trading Plan: How to Scientifically Set Take Profit Targets
Many traders know when to open a position and set a stop loss, but are often confused about when to position squaring. There is a well-known saying in the market: "Cut losses and let profits run", but this is more like a concept and lacks specific operational guidelines. "Cut losses" is relatively easy to achieve, by setting a close stop loss level, although too close may not be optimal, but at least it can control the risk. However, the boundaries of "let profits run" are difficult to grasp. How much profit expansion is reasonable? What is the best time for position squaring? This makes many people feel that position squaring is more challenging than opening a position. This article will introduce a position squaring method commonly used in institutional traders, which may not guarantee maximum profits, but can often help traders lock in profits at the right timeatfxFor users of such trading platforms, mastering such methods can help improve their trading plans.
When the market has formed a clear upward or downward trend, a price correction usually occurs. As shown in the chart below, in an uptrend, the price rises from point A to point B and then pulls back to point C; in a downtrend, the price falls from point A to point B and then rebounds to point C. After the correction, the price tends to continue the original trend. At this point, we can use the distance from point A to point B, and the distance from point B to point C, to calculate the potential profit target.
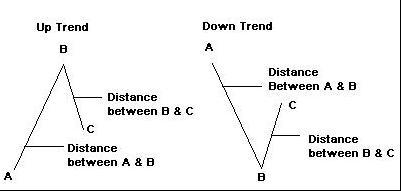
In the market, many institutional traders traditionally use Fibonacci numbers. These ratios are often seen as reasonable levels of support or resistance, so they can also be used when calculating profit targets. When trading, consider setting two profit targets. When the price hits the first target, close part of the position first, and if the price continues to move to the second target, then close the remaining position. This step-by-step strategy is a common risk management tool in professional trading environments such as ATFX.
The formulas for calculating the two profit targets, T1 and T2, are as follows:
T1 = 0.618 × (B - A) + C
T2 = B - A + C
Suppose the price of a stock rises from point A 189 to point B 278, and then pulls back to point C 245, then:
T1 = 0.618 × (278 - 189) + 245 = 300
T2 = 278 - 189 + 245 = 334
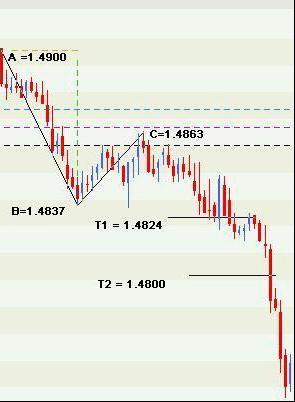
The above chart is a 5-minute chart of USD/CAD, where point A is 1.4900, point B is 1.4837, and point C is 1.4863.
T1 = 0.618 × (1.4837 - 1.4900) + 1.4863 = 1.4824
T2 = 1.4837 - 1.4900 + 1.4863 = 1.4800
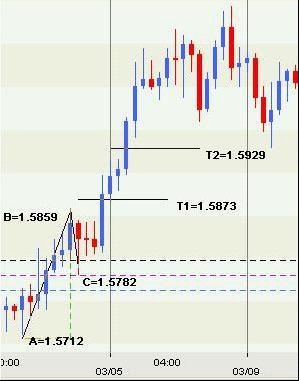
The above chart is a 4-hour chart of GBP/USD, where A = 1.5712, B = 1.5859, and C = 1.5782, so:
T1 = 0.618 × (1.5859 - 1.5712) + 1.5782 = 1.5873
T2 = 1.5859 - 1.5712 + 1.5782 = 1.5929
In addition to 0.618, traders can also use other Fibonacci ratios, such as the more conservative 0.236 or 0.382. If the calculated T1 is below the key resistance level in an uptrend, then consider T2 as the main target; the same is true in a downtrend. Flexible use of these technical tools, combined with market analysis provided by the ATFX platform, can help traders execute their trading plans more systematically.
Please indicate the source: https://www.daoctech.com/fxschool/2259.html
Disclaimer: The content of this article does not represent the views of the Institute of Foreign Exchange. The content is for reference only and does not constitute investment advice. Investors operate accordingly at their own risk.