
How to Read Forex Technical Charts
In the field of technical analysis of foreign exchange, the use of foreign exchange chart patterns to analyze the continuation or reversal of price movements occupies an important position. Let's first learn the characteristics of three common foreign exchange charts. They all express the same meaning, but the intuitive feeling and details are different.
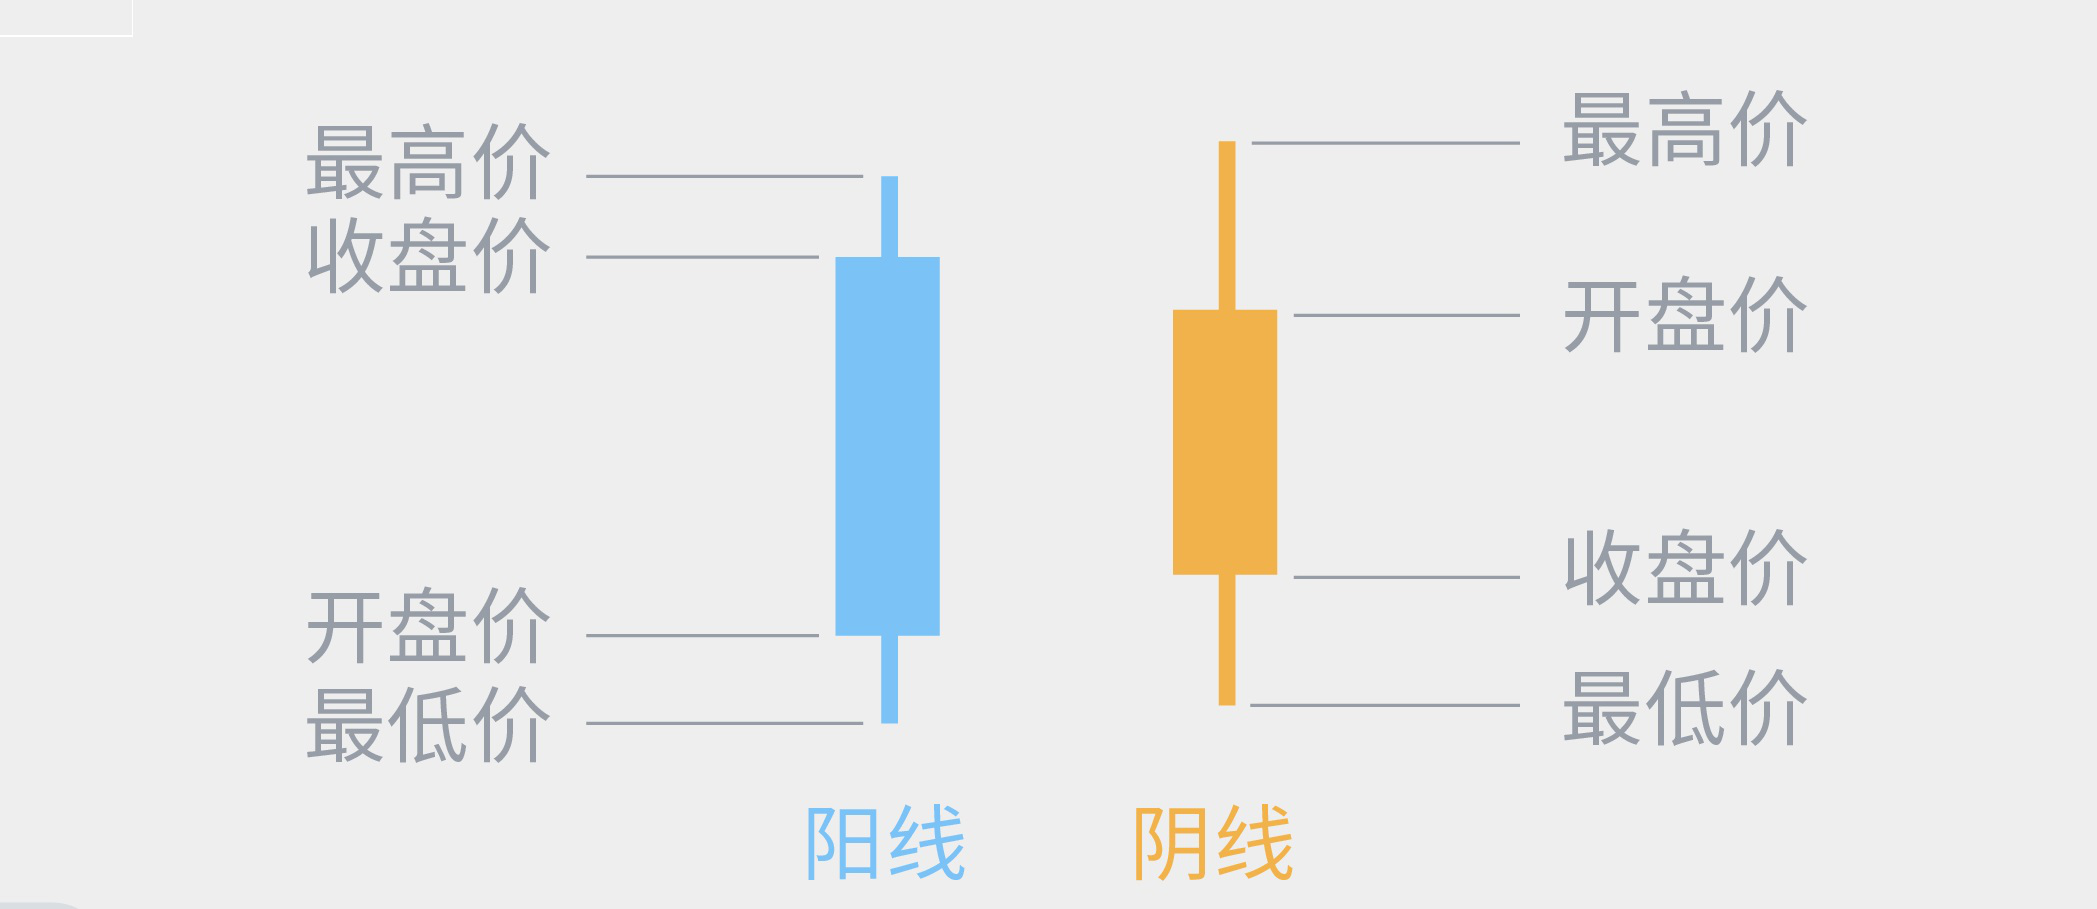
Candlestick chart: It has four elements, namely the opening price, the closing price, the highest price, and the lowest price. It is also the most commonly used and most dynamic chart type.
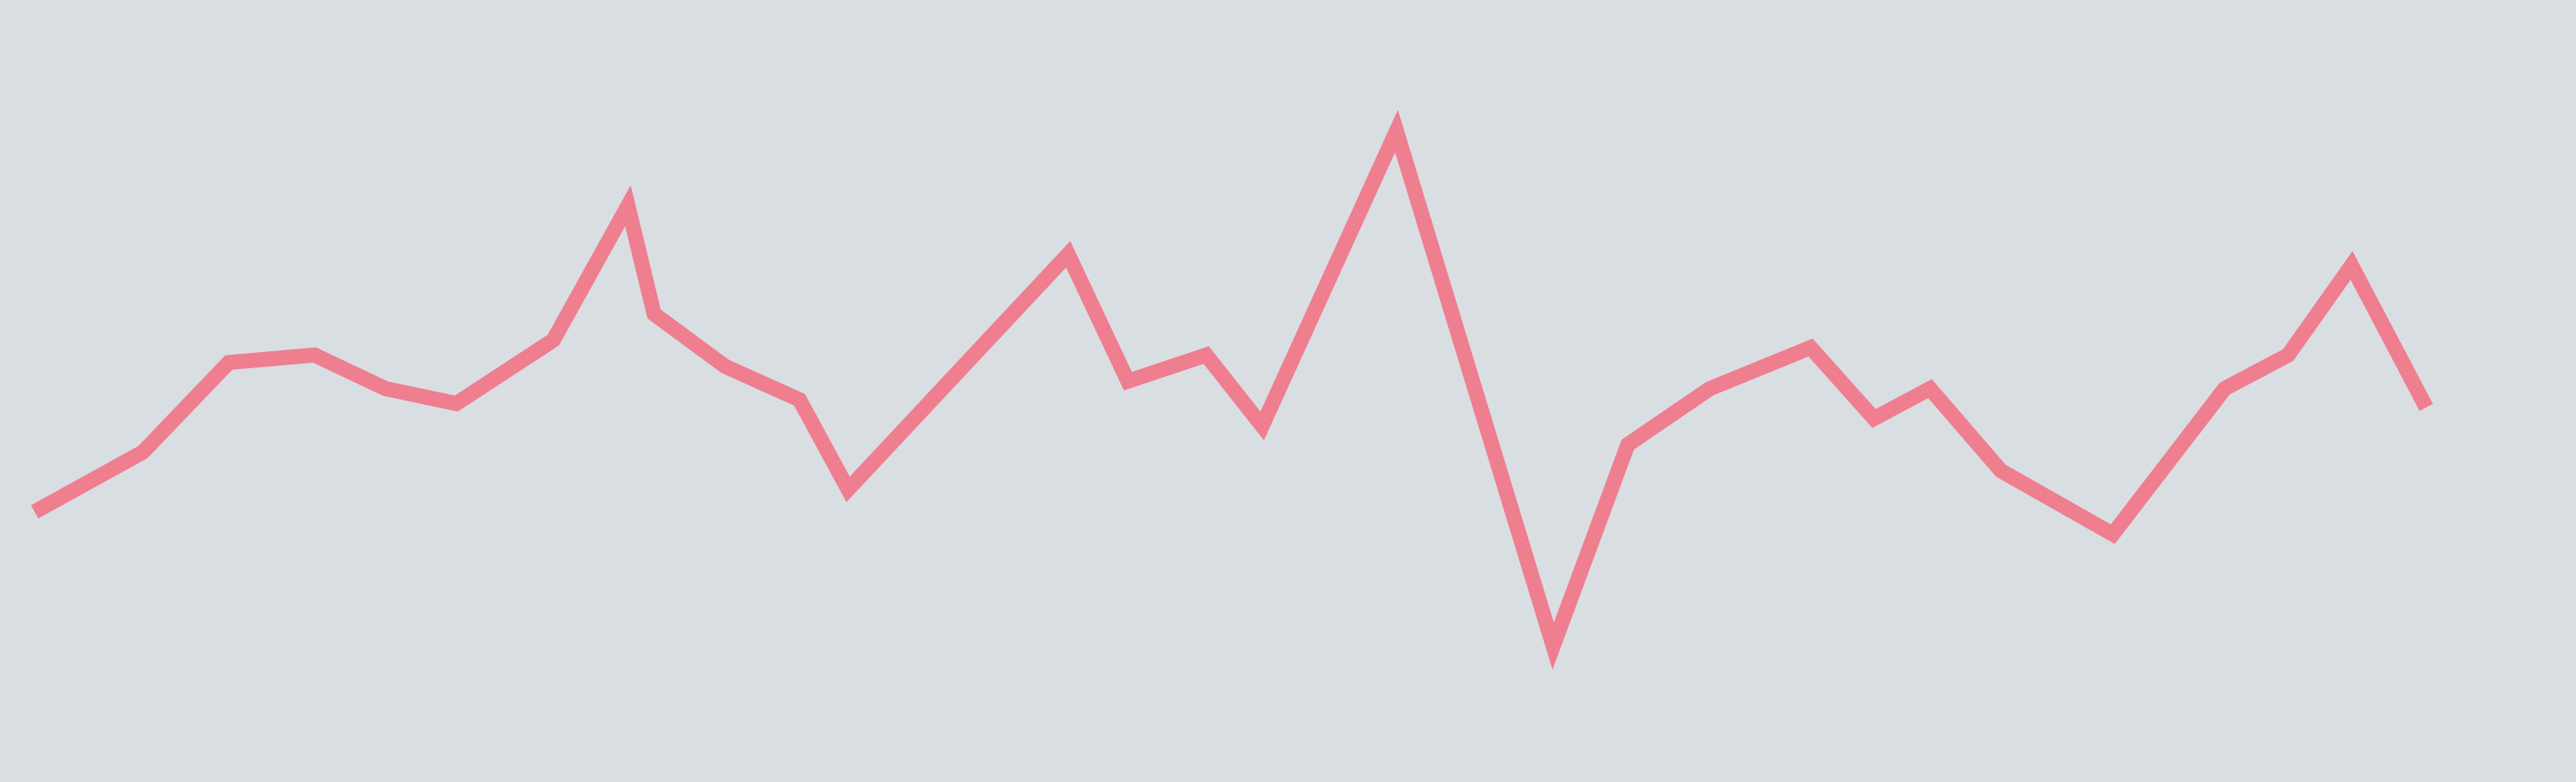
Line chart: connected by the closing prices of each time period, there is only one price in a time period, one price and one point
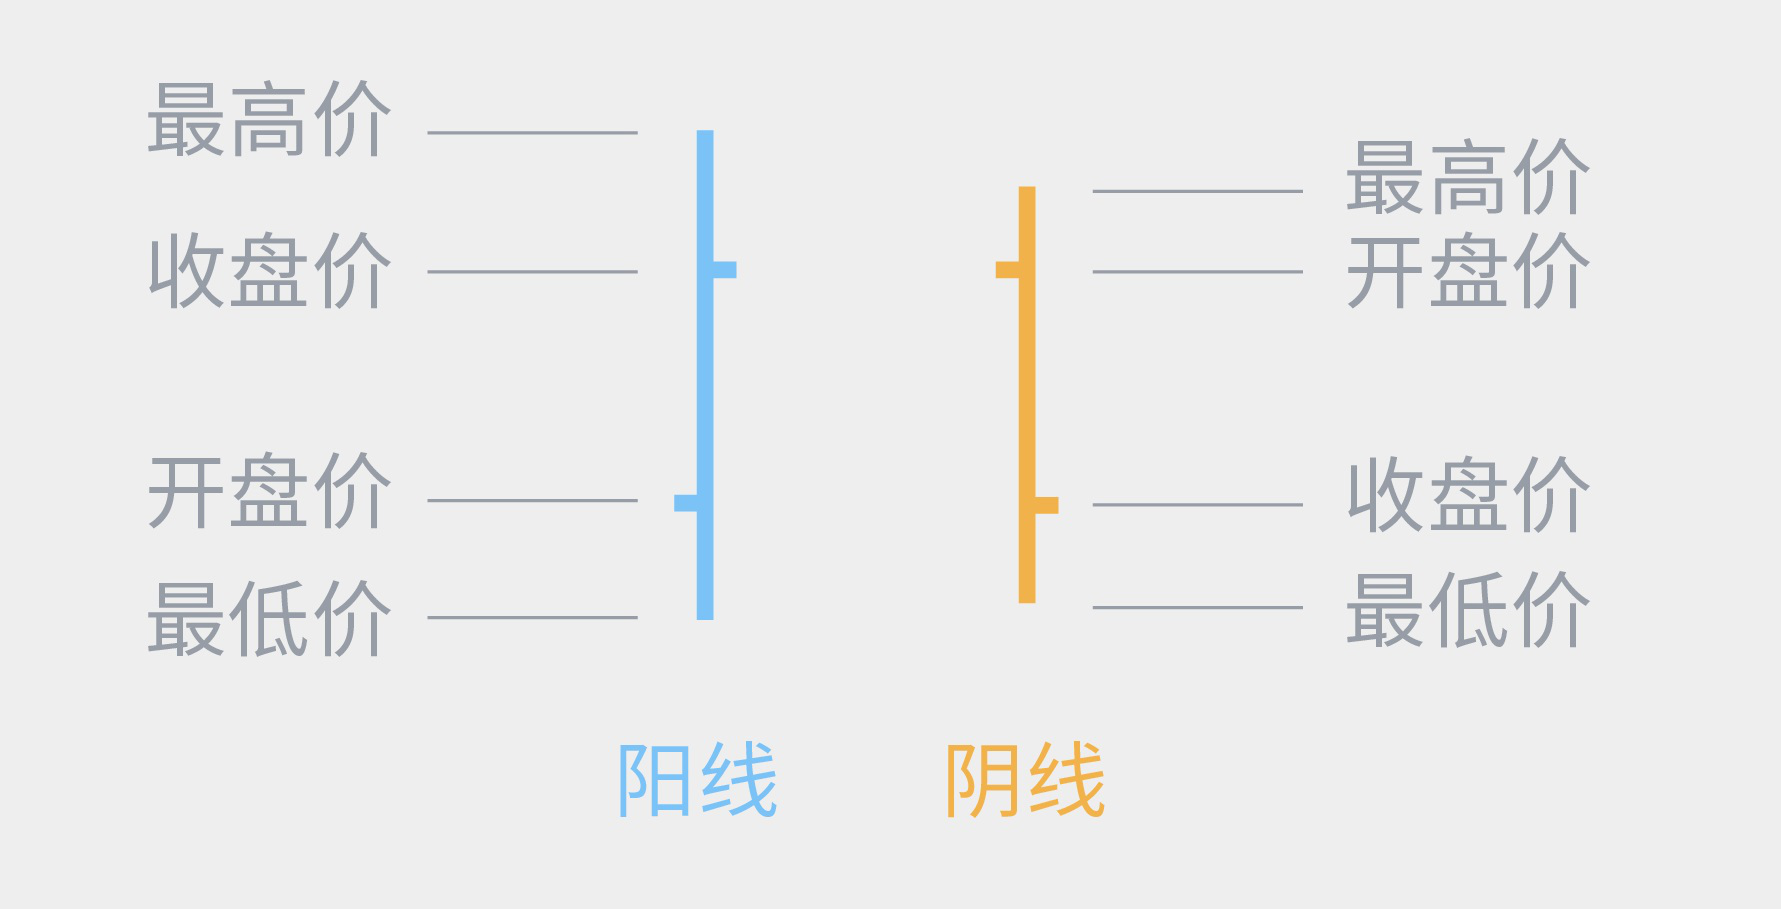
Bar charts: Also known as bar charts, they were commonly used in the early US stock market. They are similar to candlesticks and have four elements, but they are not as intuitive as candlesticks.
After understanding the three common foreign exchange charts, here are the common foreign exchange chart patterns. Chart patterns can be roughly divided into two categories:
First, the relay pattern usually occurs in the middle of the trend, which is a sign that the market has entered the finishing stage. When the pattern is completed and a breakthrough occurs, it means that the trend will continue, and the breakthrough of the relay pattern generally proceeds in the original direction of the trend. Unless there is a major market news event, the trend will continue during the completion of the relay pattern.
Another type is the reversal pattern. The completion of the pattern represents the end of the trend and the beginning of a new trend. The reversal pattern is a trader's favorite pattern. Traders can step in at the end of the formation of the pattern, which means they have seized the starting point of the new trend and obtained a good position.
Here are some common typical relay patterns and reverse patterns.
1. Double top type
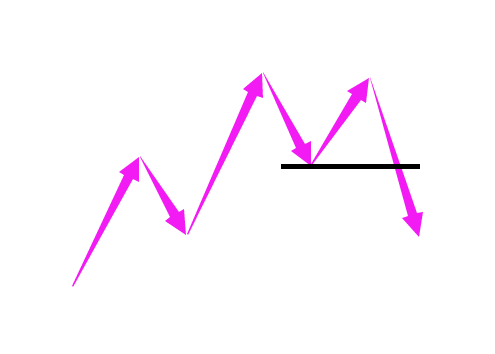
Form formation: A double top structure is formed during the rise, with the second top not exceeding the first top, and the two tops form a level. The horizontal line derived from the low point between the two vertices is the neckline of the structure.
Significance: The general double-top structure represents the beginning of a reversal in the market, which is a typical reversal pattern at the end of a rise
Trading guidance: After the formation of the double-top structure, in a falling market, the price breaks through the neckline below and enters the market short.
2. Double bottom type
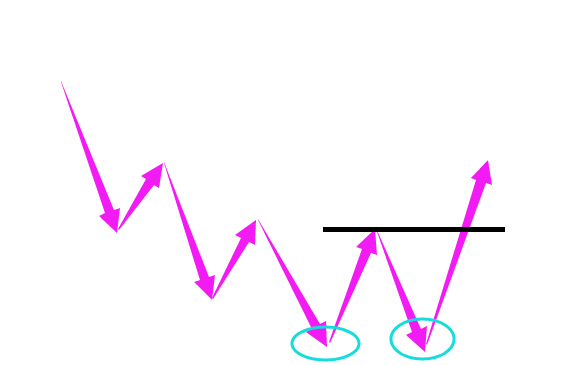
Form formation: This pattern generally appears at the end of the market, the second low generally does not exceed the first low, and the two low points show a horizontal structure. When both low points appear, a horizontal line is drawn at the high point in the middle of the two low points, which is the neckline of the double bottom pattern.
Meaning: The falling trend of the market may be coming to an end, which is a typical reversal pattern at the end of the decline.
Trading guidance: After the formation of the double-top structure, in the rising market, the price breaks through the neckline and enters the market.
3. A falling wedge
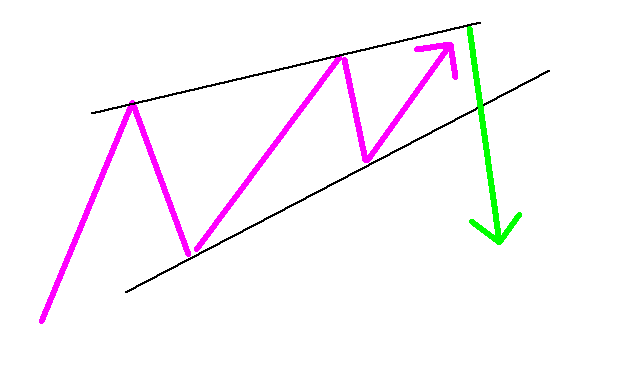
Form formation: This form is generally formed at the end of the market, and is divided into a 5-wave structure, with three waves rising and two waves falling. Among them, in the three waves rising, the strength of the rising is getting weaker and weaker, the second wave rising is weaker than the first wave, and the last third wave rising is weaker than the second wave. A slight break through the previous high point will declare the end. The connection between the two lows sandwiched between the three rising waves is the neckline of the pattern.
Meaning: It is usually the internal structure of a rising wave, indicating that the rising market has experienced a power failure and is likely to reverse.
Trading guidance: If the price breaks through the neckline below the wedge, you can go short.
4. Rising Wedge
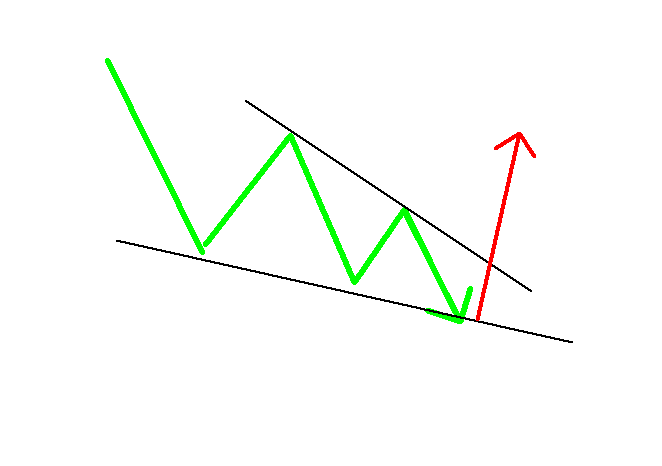
Form formation: A rising wedge is usually formed at the end of a falling market, and the last three waves fall. Although each fall can set a new low, each time the strength of the decline is significantly weakened. A group of lines connecting the two lows and two highs of the pattern forms a downward-sloping convergent triangle, and the line connecting the two highs is the neckline of the pattern.
Significance: It indicates that the downward trend is gradually weakening, and there may be a reversal of the upward trend.
Trading guidance: When the price breaks through the neckline of the rising wedge, you can go long.
Analysis of market dynamics through foreign exchange charts has obvious advantages. On the one hand, the objectivity of chart data can help traders observe the market more calmly and make accurate judgments; on the other hand, the intuitiveness of foreign exchange charts makes market observation simple and clear, and traders can quickly grasp the market trend in a short time and anticipate it first.
Please indicate the source: https://www.daoctech.com/fxschool/992.html
Disclaimer: The content of this article does not represent the views of the Institute of Foreign Exchange. The content is for reference only and does not constitute investment advice. Investors operate accordingly at their own risk.