
Technical analysis: Gold releases a bearish signal, falling below the symmetrical triangle pattern
Gold prices jumped to $3,319 at the start of trading on Monday (July 28). It was reported over the weekend that the European Union had accepted a 15% US import tariff, which is only half the level previously threatened by President Trump.
However, the market quickly returned to caution, with gold and precious metals prices rebounding above Friday's closing price, as the positive impact of the agreement on the European Union is still unclear. Under the agreement, the United States will impose import tariffs on European Union cars, while the European Union is expected to invest heavily in US energy and military equipment without taking any retaliatory measures. It is worth noting that the 50% US tariffs on European Union steel and aluminum products will remain unchanged for now.
From a technical perspective, today's decline pushed gold prices below the symmetrical triangle pattern, short-term simple moving averages, and into the Ichimoku cloud chart range, all indications suggesting a potential bearish continuation trend. With the Relative Strength Index (RSI) falling below the neutral 50 level and stochastic oscillators turning to the downside, downside risks remain dominant - especially if strong resistance forms in the $3,345 area.
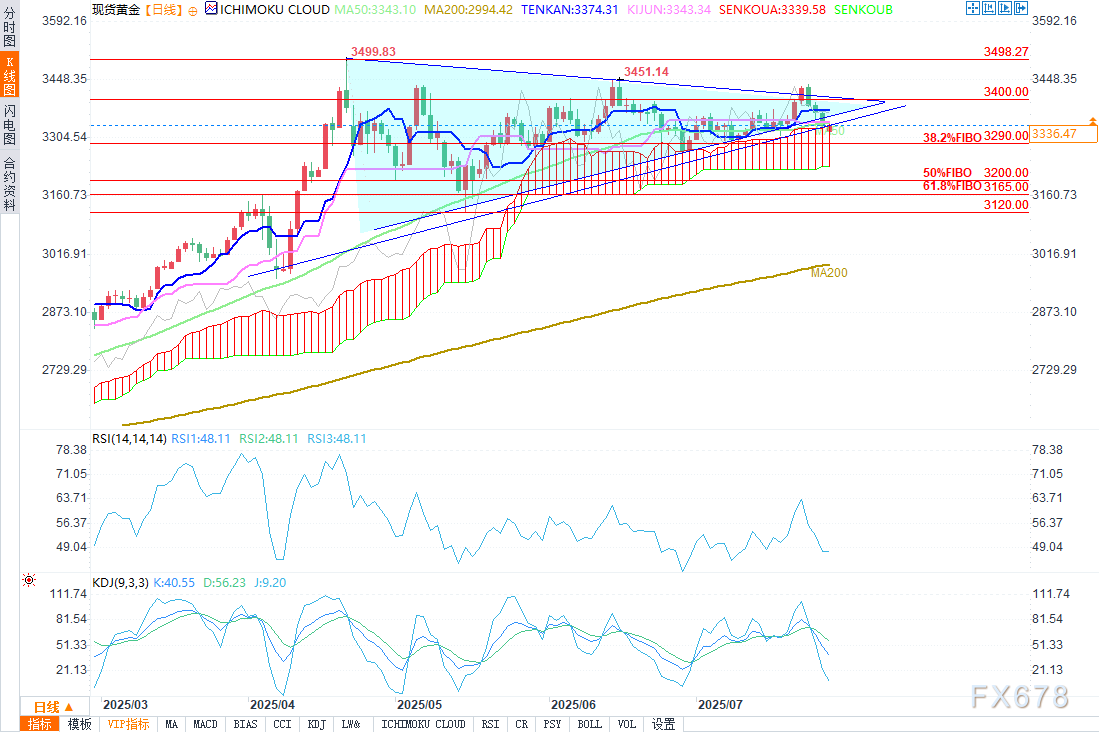
(Daily chart of spot gold, source: Internet)
If the decline continues, it is possible to preliminarily test the 38.2% Fibonacci retracement level of the April rally, around $3,290. Further declines may be cushioned near the 50% Fibonacci level of $3,230 to the key support range of $3,200. But from a general trend perspective, only a drop below the 61.8% Fibonacci retracement level of $3,165 can officially confirm the bearish trend reversal.
On the upside, a break above the $3,345 - $3,370 range could revive buying interest. However, to trigger a quick rally towards the key resistance at $3,500, a clear break above the upper triangle at $3,400 and last week's resistance at $3,430 may be required.
In short, today's decline has turned the market bearish. If there is strong resistance in the $3,345 area, selling pressure may re-emerge.
At 19:11 Beijing time, spot gold was quoted at $3,336.10 per ounce, down 0.01%.
Please indicate the source: https://www.daoctech.com/fxnews/1663.html
Disclaimer: The content of this article does not represent the views of the Institute of Foreign Exchange. The content is for reference only and does not constitute investment advice. Investors operate accordingly at their own risk.