
Technical analysis: Spot gold may drop to the $3298-3301 range
On Wednesday (August 20), spot gold rallied slightly during the Asian trading session, and the current price is around $3,318.88 per ounce.
Reuters technical analysts agree that spot gold could fall to $3,298- $3,301 an ounce based on Fibonacci ratio analysis.
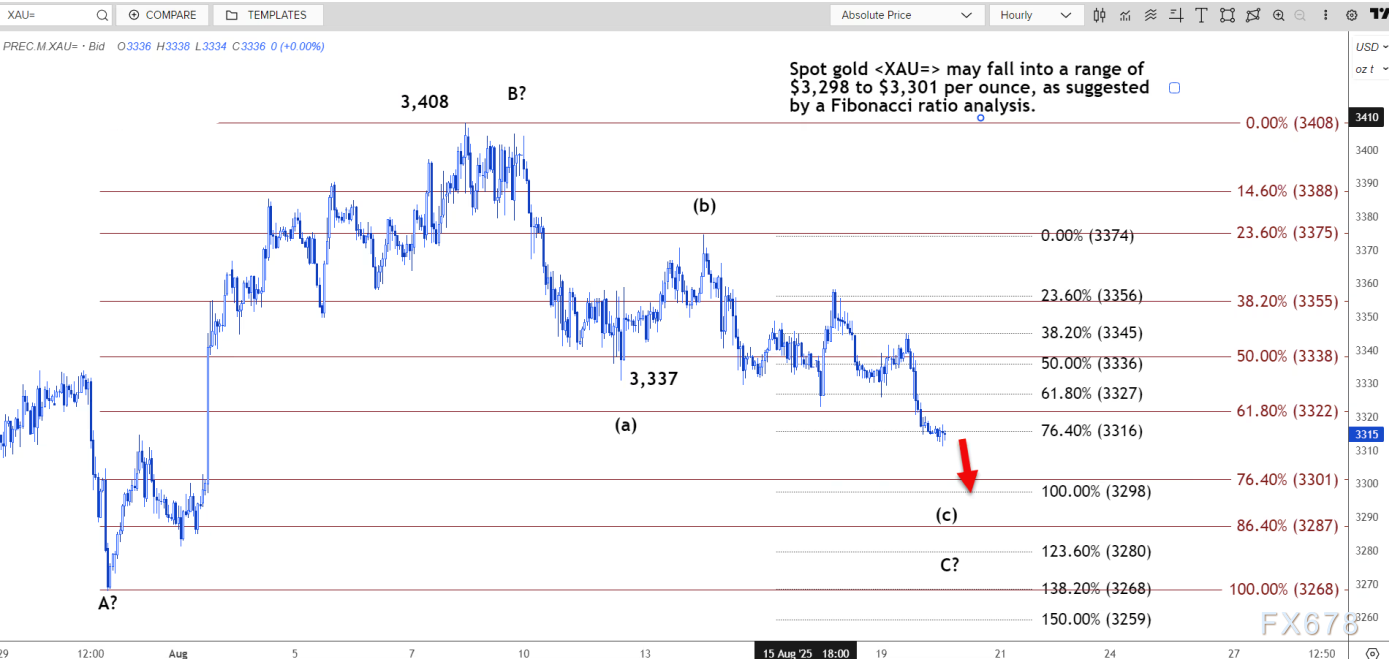
Gold prices are currently in the running phase of the (c) wave, which has fallen below the 61.8% forecast level of $3,327 and is likely to extend further to around the 100% forecast level of $3,298.
A retracement analysis of the rising band of $3,268 to $3,408 shows that the price of gold has fallen below the 61.8% retracement level of $3,322. In the retracement analysis, analysts at Depu pointed out that if this level is effectively lost, the price will continue to decline to $3,301.
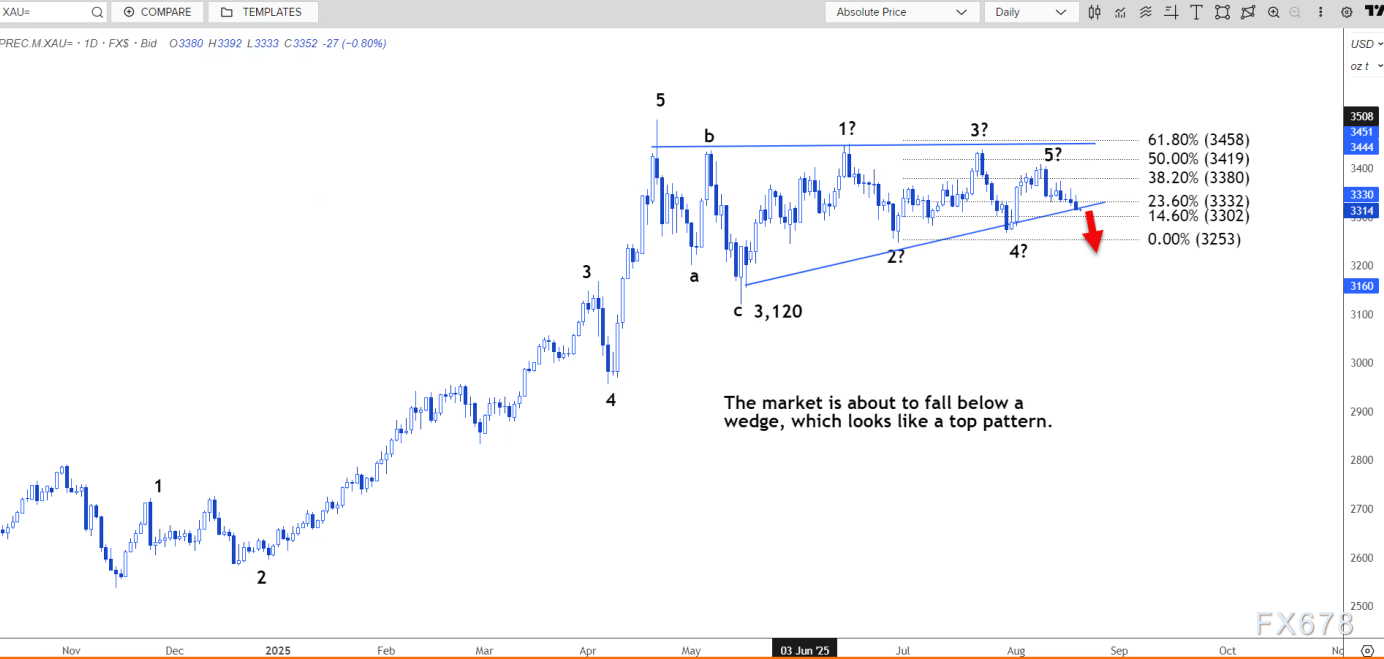
The above resistance is at $3,322. If it can break through, it may further explore the $3,327-3,336 range. Looking at the daily chart, the market is about to break through the wedge pattern, which appears to have formed a top structure.
The mini-five-wave cycle that started at $3,120 may have been declared complete, although there is a possibility that the fifth wave will fail. This completion further confirms the top feature of the wedge pattern, suggesting that the outlook target may be near $3,120.
As of 13:14 Beijing time, spot gold was quoted at $3,318.95 per ounce.
Please indicate the source: https://www.daoctech.com/fxnews/2633.html
Disclaimer: The content of this article does not represent the views of the Institute of Foreign Exchange. The content is for reference only and does not constitute investment advice. Investors operate accordingly at their own risk.