
How do support/resistance levels provide structural support to the market?
One of the fundamental principles of technical analysis is to use historical price levels to predict future price levelsforeign exchange marketIt is a market that is basically traded 24 hours a day, and there is often a large amount of data that can be used to measure future price fluctuations. Therefore, the importance of making predictions through statistical principles is particularly emphasized here. This also makes the foreign exchange market a perfect market for traders to use technical tools such as trend lines, charts, and indicators to analyze price levels.
Many traders are turningForex technical analysisAt that time, it is usually assumed that all factors affecting the exchange rate - such as economic, political, social and psychological - have been incorporated into the current exchange rate movement by the market. Technical traders use many different technical indicators combined with resistance/support levels to help them predict the future direction of the exchange rate. Such as Bollinger Bands, Fibonacci Retracement, Moving Averages, Exponential Smoothing Moving Averages, Stochastic Indicators, etc. - these technical indicators are used in conjunction with other technical indicators and chart patterns.
1. The price level at which a trend starts, pauses, or reverses, usually becomes a future support/resistance level.
2. Daily highs/lows, weekly highs/lows, and monthly highs/lows usually act as support/resistance levels for the exchange rate and are very effective.
3. Support/resistance usually refers to a price area, rather than a particular point
4. After a previous support level turns into a resistance level, it is usually very effective, and vice versa
5. The strength of a support/resistance level can usually be measured by IRATE (IRATE refers to the convergence of various indicators, the integer level; the longer the support/resistance level exists, the better; the resistance/support level is tested How many times, the more times it is tested, the better).
The early treatment of RAMM (risk and money management) should strive for excellence. "Risk" refers to how traders control risk, such as taking a stop loss on each trade, so that traders usually do not lose more than a certain amount per trade, and if there is, it will only be slightly more than a little in the case of slippage. "Money management" refers to the proportion of funds used by traders in a particular trade to their merchant account. Money management can most effectively expand the amount of profits per time, while limiting each loss to a certain range. We will discuss this topic in a later chapter.
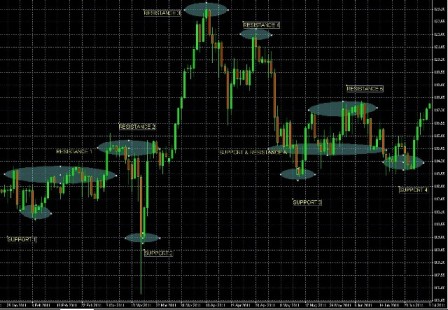
Support/Resistance: The price level
The most basic support/resistance level is the start, pause or reversal point of a trend - perhaps the most intuitive.
Take a quick look at the chart below to find out which support/resistance levels are. By looking, you will find that the best resistance/support areas are usually found at day high/low, week high/low, and month high/low. You can easily identify these points. If you find an area that is a support/resistance area for days, weeks, or even months in a row, then that area will be a strong resistance/support area.
It is important to note that the support/resistance area is a narrow price area, or range, rather than a specific price. Once the resistance level is broken, it may becomesupport level, because the market will feel that the price is relatively cheap (can be bought); once the support level is broken, it will turn into a resistance level. If the support level turns into a resistance level, it usually becomes a reliable and strong resistance level, and vice versa.
The more relevant a price is to an IRATE, the stronger it is. IRATE refers to:
1. Indicators: that is, the more indicators converge in a specific price range, the stronger the support/resistance level.
2. Round Number (integer mark): The more zeros behind the integer mark, the stronger the mark as a support/resistance level. For example: the EUR/USD 1.00 mark is stronger than 1.20;
3. Age (duration): The longer a price area acts as a support/resistance level, the stronger it becomes.
4. Tested: The more times a price area is tested as a support/resistance level, the stronger it is. However, sometimes support/resistance levels start to weaken after being tested two or three times.
Please indicate the source: https://www.daoctech.com/fxschool/1052.html
Disclaimer: The content of this article does not represent the views of the Institute of Foreign Exchange. The content is for reference only and does not constitute investment advice. Investors operate accordingly at their own risk.