
Index Bollinger Bands and Their Usage
Many indicators look perfect, like the moving average, a line that divides the rise and fall on both sides, which is both easy to identify and can be used to capture large profits. Like MACD and KDJ, they are also indicators that look perfect.
But they also have natural flaws, such as you know: the moving average will break its power when it encounters shocks, and it is easy to lose money on the left and right; MACD and KDJ encounter big wave trends, and they also make mistakes, which will provoke you to delete this indicator.
However, Bollinger Bands are different. They do not have such a fatal flaw. They can be used for both trends and oscillations. They can not only catch trends, but also see reversals, and even perform oscillations.
Such a good indicator is simply perfect, and it is worth a good understanding.
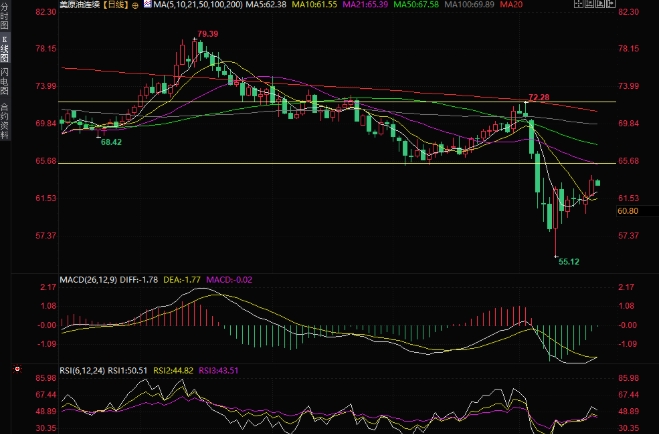
1. Recognize the indicators --- easy to identify + intuitive image
On the stock trading software, the indicator shows BOLL, and UPPER (upper track) and LOWER (lower track) are clearly marked.
On the outside trading software, it belongs to the trend indicator, the name is: Bollinger Bands. As shown in the figure above: when the market is volatile, the upper and lower track lines are mostly in a state of contraction, and the track lines are also slightly flattened.
An upward trend occurs when the price movement is between the upper and middle rail lines.
A downward trend occurs when the price movement is between the kneeling line and the mid-rail line.
2. The cornerstone of indicator perfection - relativity
Starting from the core of Einstein's theory of relativity: "Everything exists relatively." It is deduced that there is nothing alone, and there is no absolute thing. If there is black, there is white, and if there is a rise, there must be a fall, so the Bollinger Band orbital line intuitively tells everyone: the rise will not be without the sky, let alone deviate from the middle orbital line so far that it cannot be pulled back; the same is true for the fall, the price will not fall into the center of the earth and never look back.
3. Pattern recognition of indicators - double validation of signals
In the book Bollinger Bands, there is a concept of pattern recognition:
Pattern recognition is about recognizing recurring events. Prices are arranged in a certain order, so we can recognize them and take action.
In fact, this pattern is what we often call the K-line pattern structure, such as W bottom, M top, head and shoulder top pattern, etc.
Bollinger Bands can more easily identify reversal patterns and persistent patterns, so this is equivalent to Bollinger Bands can be used as a signal warning tool for one band, a trend warning tool, or a signal warning tool for multiple trends. This is like a double or multi-ring concentric circle, which allows us to see the linkage and influence of a trend, which is more conducive to us seeing the trend of the chart.
4. The usage of Bollinger Bands --- easy to learn and easy to operate
The first usage is used in trends, and the specific simple + executable operation steps are as follows:
To make a trend order, there is a safe trading method, that is, wait for the trend to be determined and find opportunities to enter the market.
The first principle is: the price breaks through the middle rail, in which the rise is the price breaking through the middle rail upwards, and the price falls below the middle rail when it falls; the second principle is: when the upward trend, the price breaks through the middle rail upwards and there is a pullback, and the middle rail acts as a support line to firmly hold the price, then use the K-line reversal signal to confirm and enter the market. It is best to use the single K-line reversal method or the K-line combination reversal method often. (There have been many such practical examples in the past, you can read the historical articles yourself) When falling, the practice and usage can be reversed, and you can make up for it yourself.
B, making a trend sheet, another radical approach, that is: seeing that there are signs of a trend to be generated, without waiting for confirmation, enter the market.
[Off topic: In the eyes of many people, this is a risky approach to guessing the top and bottom. In fact, if you have a good sense of the market and years of trading experience, when the price reaches a certain position, or when the price walks out of a familiar trend, your intuition will tell you that the trend will turn and a new trend will be generated. This is the best turning point. Trust this intuition and sense of the market, the correct rate is extremely high, and the profit is extremely high, and the risk is extremely small. This is the reward of kung fu and experience. Those who have been immersed in the market for a long time will develop a pair of extremely sharp intuitive eyes. " I don't know why, but I just feel that this position needs to be reversed. "This is often what experts say, although in the eyes of ordinary people, this seems like nonsense or like he probably won't tell you the reason and conditions for entering the game, in fact, he really entered the game by feeling.]
The first condition satisfied is: the trend has reached the end and the limit. The second condition satisfied is: the price runs to the outside of the upper or lower rail lines of the Bollinger Bands; the third condition satisfied is: there is a single K-line reversal signal.
The second usage is used in oscillations:
The first step is to see the Bollinger Bands shrink and flatten; the second step is to see that in this section of Bollinger Bands shrinkage, the nearby highs and lows are close to each other; the third step is to see that there are K lines emerging from the Bollinger Bands. When the upper and lower rail lines are gentle, it is necessary to form a high and low point in the oscillation, which is near the best position to place an order. The fourth step is to see the K line reversal signal and enter the field.
5. Precautions
① Bollinger channels define relative highs and lows, not absolutes. ② If prices hit the upper, middle and lower trajectories of the channel, remember that they are not necessarily signals of entry or exit, although sometimes they are signals of entry and exit. ③ Perfect indicators ≠ indicators of absolute signals, there is no 100% certain indicator in this world. In financial marekt, if you hear the conditional "if it is what it is, it must be what it is", please be vigilant, either you have met a fairy by chance, or you have met a liar or an ignorant and arrogant person.
Please indicate the source: https://www.daoctech.com/fxschool/1590.html
Disclaimer: The content of this article does not represent the views of the Institute of Foreign Exchange. The content is for reference only and does not constitute investment advice. Investors operate accordingly at their own risk.