
Periodic resonance in financial marekt
Periodic resonance in financial marekt means that technical indicators, price movements or market sentiment of different time periods form synchronized signals at the same time point, thus enhancing the effectiveness of trading signals. This phenomenon can help traders identify high-probability trading opportunities and improve decision-making accuracy.
The Core Principle of Periodic Resonance Periodic Resonance is based on the following key concepts: Multiple Time Period Analysis: The market consists of fluctuations in different time periods (e.g. short, medium, long term). Harmonic Resonance: When the trend direction of multiple cycles is consistent, the market momentum is stronger and the trend continuation is more likely. Fibonacci Time Period: Certain key time windows (e.g. Fibonacci numbers such as 5, 8, 13, 21, 34, 55, 89, etc.) may form resonance points.
Common Types of Periodic Resonance
1. Time Period Resonance Short Period + Long Period Synchronization: For example, the daily, weekly, and monthly lines appear at the same time to buy signals (such as moving average gold forks, MACD bottom divergences, etc.). Fibonacci time windows coincide: For example, prices appear at the same time in the 55-day cycle and the 89-day cycle.
2. Resonant EMA Resonance for Technical Indicators: For example, the 5-day EMA, the 20-day EMA, and the 50-day EMA diverge upwards at the same time. MACD Resonance: MACD of different time frames (e.g. 1 hour, 4 hours, daily) appear at the same time as a gold fork or a dead fork. RSI/KDJ Overbought Oversold Resonance: RSI or KDJ of multiple cycles enter the oversold or overbought zone at the same time.
3. Price Pattern Resonance Support/Resistance Resonance: Key support or resistance levels coincide across different periods (e.g. daily front lows overlap with weekly trendline support). Wave Theory Resonance: Different sub-waves of the Elliott Wave form a consistent structure over multiple time periods.
How to take advantage of Cycle Resonance Trading?
1. Multi-Time Frame Analysis (MTFA) Long-period trend-setting (weekly, monthly): Determine the general direction of the market. Mid-cycle opportunity-finding (daily, 4-hour): Identify key supports/resistances. Short-cycle entry (1 hour, 15 minutes): Find accurate buy and sell points. Example: Weekly: Uptrend, price back on 20-week moving average support. Daily: MACD bottom divergence, RSI oversold. 1 hour: Break through the downward trend line and form a bullish K-line pattern. → Resonance signal is strong, you can consider going long.
The Fibonacci time cycle is combined with price action to observe whether key Fibonacci time windows (e.g. 21 days, 55 days, 89 days, etc.) coincide with price turning points.
3. Indicator superposition resonance For example: moving average: 5-day, 20-day, 50-day moving average long arrangement. MACD: daily and weekly gold forks at the same time. Volume: Volume confirmation when breaking through.
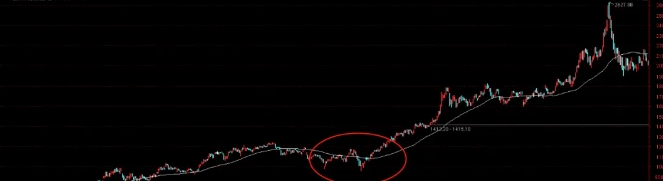
Practical Case of Cycle Resonance Case 1: Stock Trend Continuation (EMA Resonance) Kweichow Moutai (March 2020): Weekly Line: 20-Week EMA Support + MACD Gold Fork. Daily Line: 50-Day EMA Support + RSI Oversold Rebound. 1 Hour: Break through the short-term downward trend line. → Then the stock price rose sharply.
Case 2: Start of Cryptocurrency Bull Market (Multi-Cycle Breakout) Bitcoin (October 2020): Monthly Line: Break Through 2019 High. Weekly Line: EMA Bulls Arrangement + MACD Gold Fork. Daily Line: Volume Breaks Through Key Resistance. → Then the Big Bull Market starts.
Notes on Periodic Resonance
Advantage: Improved trading signal reliability. Reduced false breakouts and noise interference. Suitable for trend following and band trading.
Risks: Over-reliance on resonance may lead to missed early opportunities (judged in combination with trend strength). Different cycles may diverge briefly (e.g. daily bullish but weekly still falling). Need to be verified in combination with fundamentals or market sentiment (e.g. Federal Reserve policy, black swan event).
Summarize that periodic resonance is an important method to improve the winning rate of transactions. The core lies in:
1. Multi-time period analysis (trend confirmation). 2. Consistency of technical indicators (strengthening signal). 3. Overlay of key price levels (support/resistance overlap). 4. Combine volume and sentiment (avoiding false signals). Best practice: Look at the big cycle to set direction first, then look at the small cycle to find the entry point, and wait for multiple indicators or price action to confirm the resonance signal.
Please indicate the source: https://www.daoctech.com/fxschool/1617.html
Disclaimer: The content of this article does not represent the views of the Institute of Foreign Exchange. The content is for reference only and does not constitute investment advice. Investors operate accordingly at their own risk.