
A picture of commodity support resistance: gold, silver oil and gas + platinum, palladium and copper agricultural futures (February 5, 2026)
A picture of commodity support and resistance: gold, silver, oil and gas + platinum, palladium, copper + agricultural futures, updated at 13:20 on Thursday, February 5, 2026, covering 14 varieties of gold, silver, platinum, palladium, copper + crude oil, natural gas, fuel + wheat, corn and cotton. For more details, please refer to the latest information analysis in the special chart.
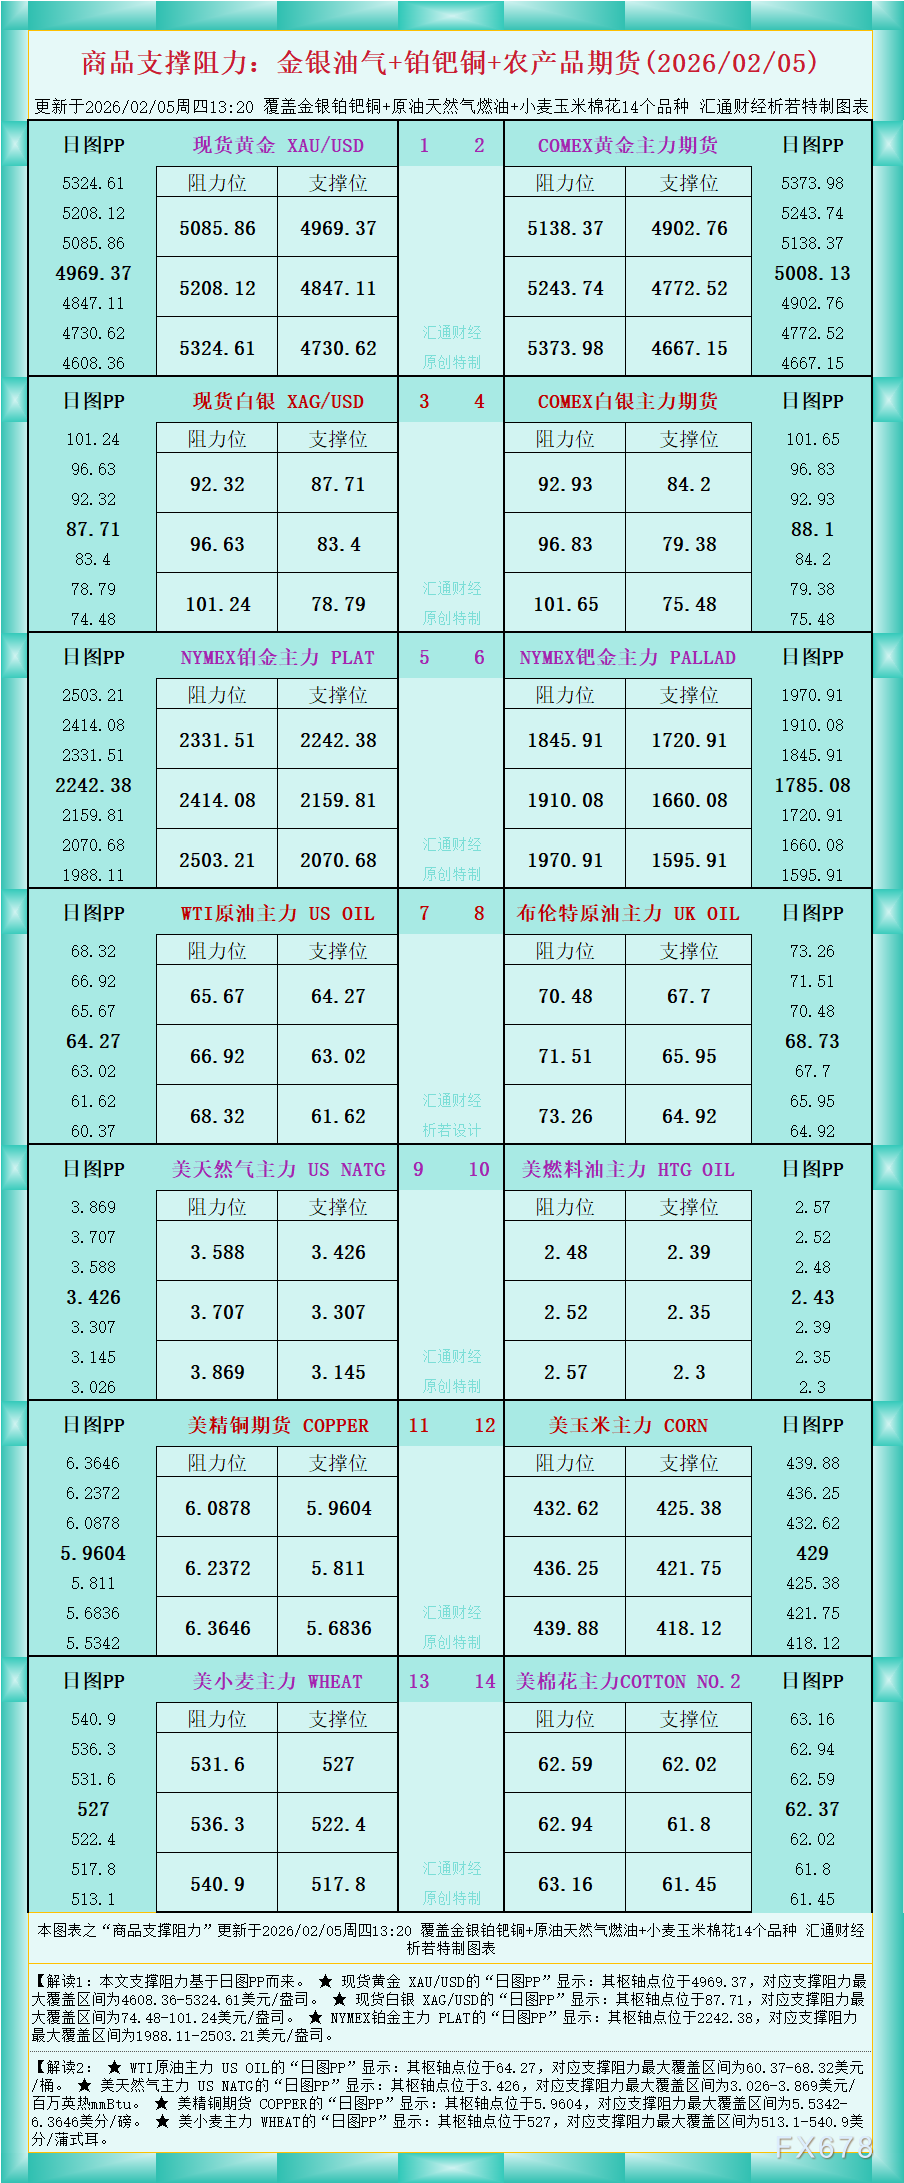
As the data in the figure shows, interpretation 1: This support resistance is based on the daily chart PP.
★ The "daily chart PP" of spot gold XAU/USD shows that its pivot point is at 4969.37, corresponding to the maximum coverage range of support resistance at 4608.36-5324 US dollars/ounce.
★ The "daily chart PP" of spot silver XAG/USD shows that its pivot point is at 87.71, and the maximum coverage range corresponding to support resistance is 74.48-101 US dollars/ounce.
★ The "daily chart PP" of NYMEX platinum main PLAT shows that its pivot point is located at 2242.38, and the maximum coverage range of corresponding support resistance is 1988.11-2503 US dollars/ounce.
Interpretation 2:
★ The "daily chart PP" of the main US OIL of WTI crude oil shows that its pivot point is at 64.27, and the maximum coverage range of the corresponding support resistance is 60.37-68 US dollars/barrel.
★ The "daily chart PP" of US NATG, the main force of US natural gas, shows that its pivot point is at 3.426, and the maximum coverage range of the corresponding support resistance is $026-3.869/million British thermal mmBtu.
★ The "daily chart PP" of COPPER of US refined copper futures shows that its pivot point is at 5.9604, and the maximum coverage range corresponding to support resistance is 5.5342-6.3646 cents/pound.
★ The "daily chart PP" of WHEAT, the main force of US wheat, shows that its pivot point is at 527, and the corresponding maximum coverage range of support resistance is 513.1-540 cents/bushel.
For more variety interpretations, please refer to the chart. The latest information is original and specially made, all rights reserved, for reference only.
Please indicate the source: https://www.daoctech.com/fxschool/2178.html
Disclaimer: The content of this article does not represent the views of the Institute of Foreign Exchange. The content is for reference only and does not constitute investment advice. Investors operate accordingly at their own risk.