
Growth spreads widen, can the USD/CAD hit 1.3778 twice?
On Friday (August 29), the US dollar/Canadian dollar (USD/CAD) played a game with Canada's GDP in the second quarter around the July PCE inflation in the United States. PCE maintained an annual rate of 2.6%, and the core PCE annual rate rebounded to 2.9%, with monthly rates of 0.2% and 0.3% respectively. Canada's real GDP fell by 0.4% in the second quarter compared with the previous quarter, exports plummeted by 7.5%, inventory accumulation increased by 30.01 billion Canadian dollars, and private sector capital expenditure weakened, with an annualized growth rate of -1.6%.
The growth gap between the US and Canada was further magnified: the US grew at a second-estimated annualized rate of 3.3% in the second quarter. Against this backdrop, the USD/CAD 30-minute chart fluctuated around the 1.376 line, and short-term volatility rose from low levels. Traders focused on the pricing of the interest rate path before the September interest rate meeting and the potential earlier/deeper easing risks of the Bank of Canada.
Fundamentals
In the US, the overall PCE inflation result in July was "in line with expectations". The core annual rate of 2.9% rose slightly from 2.8% in June, and the monthly rate continued to be moderate at 0.3%; the headline annual rate was stable at 2.6%, and the monthly rate was 0.2%. Combined with the more dovish remarks of the Federal Reserve Chairperson at Jackson Hole - emphasizing the rising downside risks to the labor market and believing that the impact of tariffs on inflation may be short-lived - the market continues to maintain the mainstream consensus of "September interest rate reduction of 25bp", but there are still differences on the cumulative rate and pace of interest rate cuts throughout the year. The PCE reading did not trigger directional fluctuations in the dollar, but was more reflected in the reassessment of the final value and path of interest rates: on the one hand, the "stickiness" of core inflation has not completely subsided; on the other hand, the momentum of employment and demand has slowed down significantly, limiting the sustainability of the upward trend of US bond yields.
Canada: GDP in the second quarter was significantly weaker than + 0.5% in the first quarter by -0.4% quarter-on-quarter. The decline in exports and weak equipment investment jointly weighed on real activity. Corporate destocking constrained growth, while household consumption rebounded to 1.1% in the context of wage growth of only 0.2%, which was more reflected in structural "squeeze" than aggregate expansion. In contrast, the resilience of the US economy at an annualized 3.3% widened the growth interest rate gap between the two countries. The market quickly raised the price of the Bank of Canada's "early/larger interest rate cut" relative to the Federal Reserve, suppressing the continuity of the Canadian dollar's rebound.
Overall, the dollar did not suffer significantly after the PCE "boots landed", while the unexpectedly weak growth in Canada limited the room for retracement above the USD/CAD, and the exchange rate showed more of an event-driven range-pulling pattern.
Technical aspects:
The 30-minute K-line shows that the Bollinger middle rail is at 1.3752, the Bollinger upper rail is 1.3766, and the lower rail is 1.3739; the latest price fluctuates around 1.3760. After the intraday rush to 1.3778, it quickly fell back, confirming the first resistance near the upper rail; below it formed a double low resonance support at 1.3736 and 1.3740. In terms of MACD, DIFF = 0.0002, DEA = 0.0000, and the bar chart turned positive to 0.0004, showing that the kinetic energy changed from negative to positive but the intensity is limited; RSI (14) is about 53.7, slightly too much but not into the overbought area.
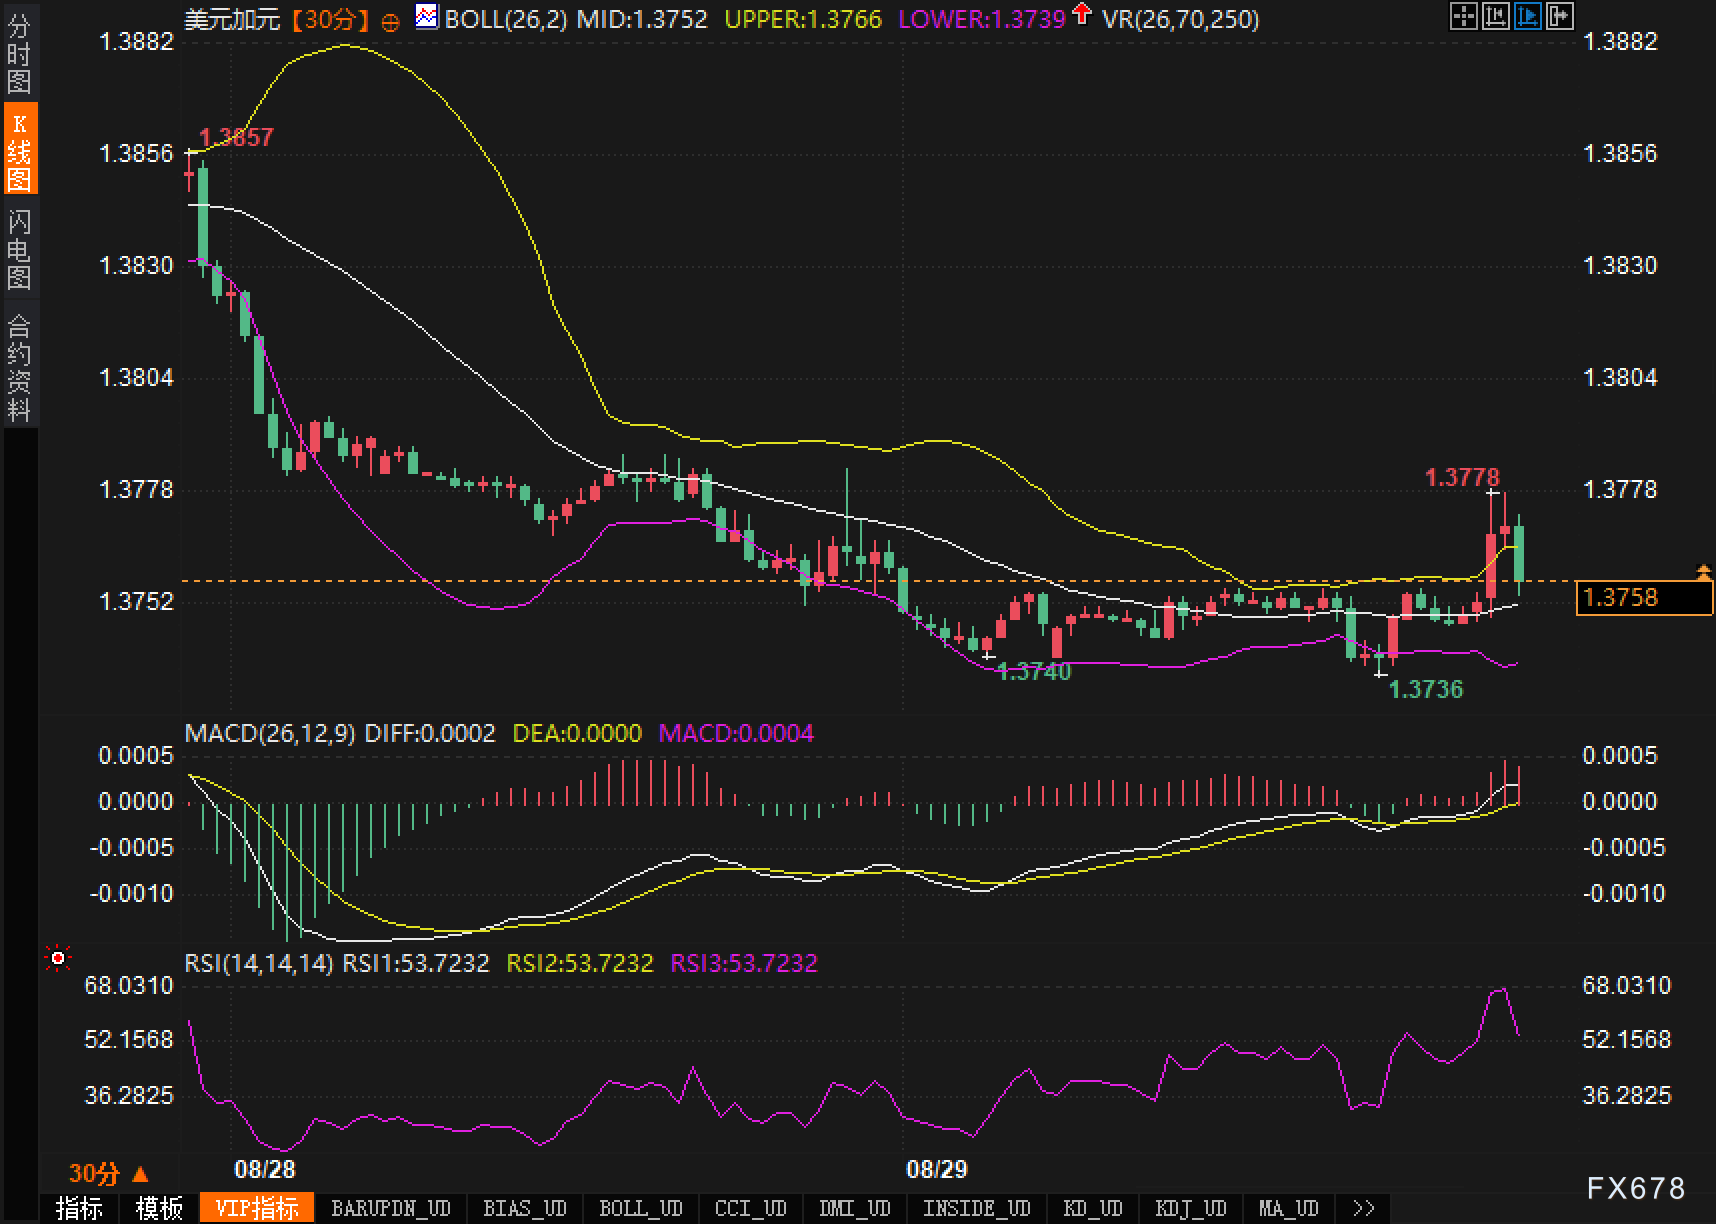
Morphologically, the Bollinger Bands had previously experienced a marginal opening after "extrusion", superimposed with the rhythm of "blocked uprush + stepping back on the middle track", which was more like a technical rebound started from a low level (1.3736-1.3740 area), and had not yet evolved into a clear trend reversal.
Price level: 1.3752 is the current pivot level (Bollinger middle rail); the upper resistance is 1.3766 (upper rail dynamic resistance) and 1.3778 (high point of the day) in turn; if the volume breaks through, it will further pay attention to the historical resistance magnetism of the left high of 1.3857. The lower support focuses on the "double bottom neck" of 1.3740 and 1.3736. Once lost, the Bollinger lower rail 1.3739 and the short and medium-term lows will constitute a pressure reversal, and the risk of technical retracement will increase. The overall volume and price and the indicator structure together point to: the "narrow upward range" under the long-empty saw, which needs to be catalyzed by fundamentals or can break through to confirm the direction.
Outlook
Bulls Outlook: If the follow-up US data remains resilient on employment and service prices, and the Federal Reserve starts to cut interest rates but emphasizes "gradual and data-dependent", the US dollar interest rate spread and real yield remain resilient; superimposed Canadian data continue to confirm weak external demand and pressure on corporate investment, the USD/CAD is expected to continue the "step-up". Technically, once it effectively stands at 1.3778 and stabilizes above Brin's upper rail, the price will enter the "walking on the track" state, and the next focus will be moved to the historical resistance of 1.3857; if the MACD synchronously amplifies the positive column during the period and the "secondary golden fork" of DIFF to DEA appears, the bulls' momentum will be quantitatively verified. However, it needs to be emphasized that the continuation of the short-cycle trend still depends on the amount of energy to break through. If the amount of energy is insufficient, the breakthrough will easily evolve into a "false breakthrough + backtest medium track" shock lengthening.
Bearish outlook: If the follow-up data from the United States points to a faster cooling of demand, or the Federal Reserve's forward guidance releases a stronger "easing trend", the dollar pullback superimposed risk appetite repair will suppress the USD/CAD; at the same time, if there is a "marginal improvement" in the high-frequency data released by Canada, it is more likely to trigger a short-term pullback. Technically, if the 1.3752 medium rail is broken down by volume, and the resonance support of 1.3740/1.3736 is lost, the Bollinger lower rail 1.3739 will be transformed from "dynamic support" to "above resistance", and the structural pullback will point to the replacement demand in the early intensive trading area. On the indicator side, once the RSI falls below 50 and the MACD bar chart turns negative and expands again, the bears will gain momentum resonance. However, considering the fundamental constraints on Canada's growth, if the bears want to interpret it as a "unilateral downside", they still need the catalysis of a large external positive for the Canadian dollar.
Please indicate the source: https://www.daoctech.com/fxschool/1738.html
Disclaimer: The content of this article does not represent the views of the Institute of Foreign Exchange. The content is for reference only and does not constitute investment advice. Investors operate accordingly at their own risk.